June 25, 2026 | Markets & Technology
Pre-market looked like a gift. Asian indices were ripping, Japan’s Nikkei +4.4%, South Korea’s KOSPI +5.2%, on the back of Micron’s blowout earnings after Wednesday’s close. PCE inflation data dropped at 8:30 AM and came in well-behaved enough to spark a relief rally. SPY pushed to 739.79, QQQ surged, NVDA bounced. Everything looked great going into the opening bell. It looked like this week’s tech carnage was finally over.
It wasn’t. By 9:59 AM, SPY, QQQ, and NVDA all hit their intraday lows simultaneously. What happened in between is a story about crowded positioning, a fragile macro backdrop, and a market that had been quietly cracking for weeks before today’s whipsaw made it obvious.
The Numbers
By midday, the divergence across tech was striking:
| Ticker | Change | Note |
|---|---|---|
| AAPL | -5.76% | Worst performer in Mag 7 |
| MSFT | -3.46% | Second consecutive down day |
| META | -1.71% | Ad revenue concerns resurfacing |
| AMZN | -2.26% | AWS growth narrative under pressure |
| GOOGL | -0.87% | Dow addition couldn’t hold sentiment |
| NVDA | -1.04% | Pared losses on Micron tailwind |
| TSLA | +0.02% | Effectively flat, decoupled from tech |
| MU | +16.07% | The hero of the day — more below |
| QCOM | +7.76% | Beneficiary of Apple chip supply shift |
| INTC | +0.06% | Gapped 6% at open, gave it all back |
| AMD | +2.15% | Quietly holding up |
| ASML | +4.57% | Equipment names catching the MU bid |
| SMH | +3.48% | Semiconductor ETF masking single-stock pain |
The VanEck Semiconductor ETF (SMH) closing up 3.48% on a day when AAPL lost nearly 6% tells you everything about how bipolar this market has become. Memory chips are thriving. Consumer tech is getting hit. The index is lying to you.
The Week That Built This Morning
Today didn’t happen in isolation. To understand the opening bell flush, you have to go back three weeks.
It started on June 5 when a stronger-than-expected May jobs report sent Treasury yields spiking and triggered a violent semiconductor selloff — the Nasdaq’s worst single day since the tariff turmoil of early 2025. Then Broadcom’s earnings on June 3 added fuel: the company beat on revenue but notably declined to raise its full-year AI chip forecast, sending its stock down 14% and rattling confidence across the supply chain.
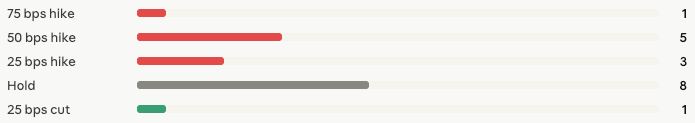
By the time this week arrived, the AI semiconductor trade was already sitting on a knife’s edge. Tuesday’s session crystallized the anxiety. A Bank of America research note flagging the possibility of up to three Federal Reserve rate hikes in 2026 hit the tape, and the market reacted like someone pulled a fire alarm in a crowded theater. The Nasdaq fell 2.21%. South Korea’s KOSPI plunged nearly 10% — its steepest decline in months — as Samsung and SK Hynix collapsed on fears that the AI memory rally had run too hot, too fast.
The Fed’s own dot plot, released at last week’s June meeting, had already removed the projected 2026 rate cut. Nine of eighteen policymakers were now penciling in a hike. PCE inflation was tracking at 3.3–3.6% — well above the Fed’s 2% target.
That was the backdrop walking into this morning.
The Micron Factor: A Tale of Two Tapes
Micron’s Q3 2026 results, reported after Wednesday’s close, were genuinely historic. Revenue of $41.46 billion — up from $23.86 billion the prior quarter and a staggering $9.30 billion in the year-ago period. EPS of $25.11, blowing past the $20.20 consensus estimate by more than 24%. Cloud Memory gross margins hit 83%. The company’s HBM (High Bandwidth Memory) product line, the backbone of AI accelerator systems, is sold out through the end of the year.
This was the catalyst that sent Asia ripping overnight and made the pre-market look so promising. Memory chip names — ASML, QCOM, AMD — all opened strong. SMH gapped up. The narrative was simple: Micron proved the AI infrastructure buildout is real, accelerating, and enormously profitable.
But here’s the problem. The market had already priced in a monster quarter. MU shares had run to an all-time high earlier this week before pulling back 13% ahead of the print. When results came in and the stock surged 16%, it was recovering losses — not making new ground. And crucially, the Micron tailwind was specific to the memory supply chain. It did nothing to address the macro overhang that has been quietly suffocating consumer-facing tech names.
AAPL down nearly 6% today is not a Micron story. It’s a rate story, a valuation story, and a rotation story — all at once.
Apple: The Day’s Defining Move
AAPL’s nearly 6% decline deserves its own paragraph because it’s the clearest signal of what’s actually happening beneath the surface.
The stock opened at $287, already down from Wednesday’s close of $293. It never recovered. By midday it was trading at $276 — a level last seen in early June. Over the past month, AAPL has fallen from $315 to $276, a drawdown of more than 12% with no single obvious catalyst. That’s not a headline event. That’s systematic selling by large holders rotating out of a name that had become the ultimate “safe tech” parking spot in an era of elevated rates.
At current interest rates and with the Fed now openly discussing hikes, the premium investors were willing to pay for AAPL’s predictability and buyback program has compressed. When you can get 4.5% in Treasuries with zero credit risk, paying 30x earnings for a company with slowing iPhone growth requires a level of conviction that is evaporating.
Meanwhile, QCOM surged 7.76% today — directly benefiting from recent reports that Apple is diversifying its chip supply chain, a move that benefits Qualcomm at AAPL’s expense. The rotation within the sector is surgical.
The Gap-and-Trap: What Really Happened at 9:30 AM
The synchronized low across SPY, QQQ, and NVDA at exactly 9:59 AM was not a coincidence. It was the conclusion of a coordinated distribution sequence that played out in the first twenty-nine minutes of trading.
Pre-market optimism — built on the Micron beat and the Asian market surge — created a window of artificial demand at the open. Retail and momentum traders, seeing the green futures and the PCE relief, bought aggressively. SPY pushed to 739.79, within striking distance of the prior session high at 739.95. QQQ surged. The tape looked bullish.
What the tape didn’t show was the institutional selling happening into that demand. Large players who had been positioned bearishly all week — some visibly, through deep in-the-money put positions in the tens of millions of dollars — used the open rip as a distribution opportunity. Once that buying was absorbed, the bids evaporated simultaneously across all three instruments, producing the synchronized 9:59 AM flush that took SPY from 739 to 729.60 — a move of more than nine dollars in less than thirty minutes.
The $730 strike on SPY put options, which carried over 10,000 contracts of open interest entering today, caught the low almost to the dollar. That is not coincidental. It is GEX structure — gamma exposure from dealer hedging — functioning exactly as it should.
The Macro Ceiling That Won’t Move
Underlying all of today’s price action is a simple and stubborn reality: the Federal Reserve has effectively told the market that the rate cutting cycle is over, and a hiking cycle may be beginning.
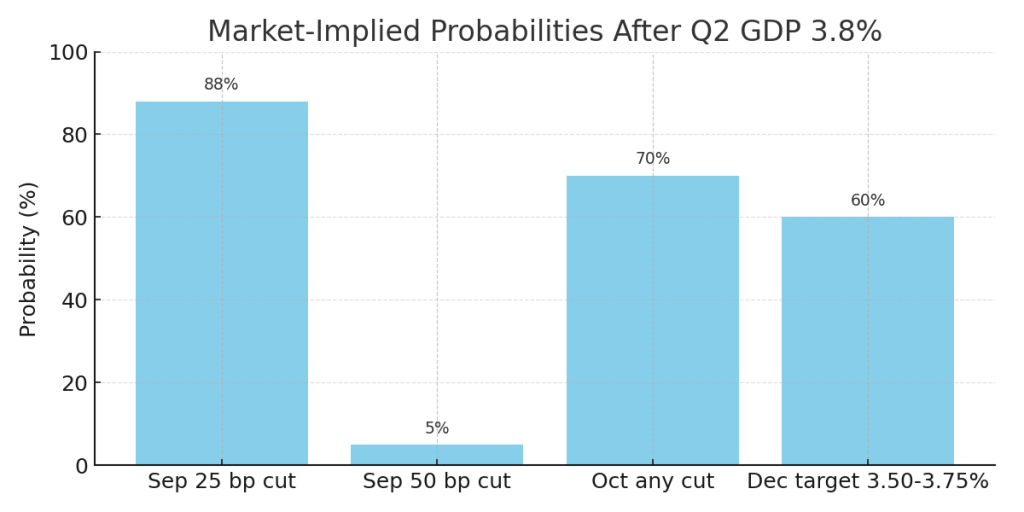
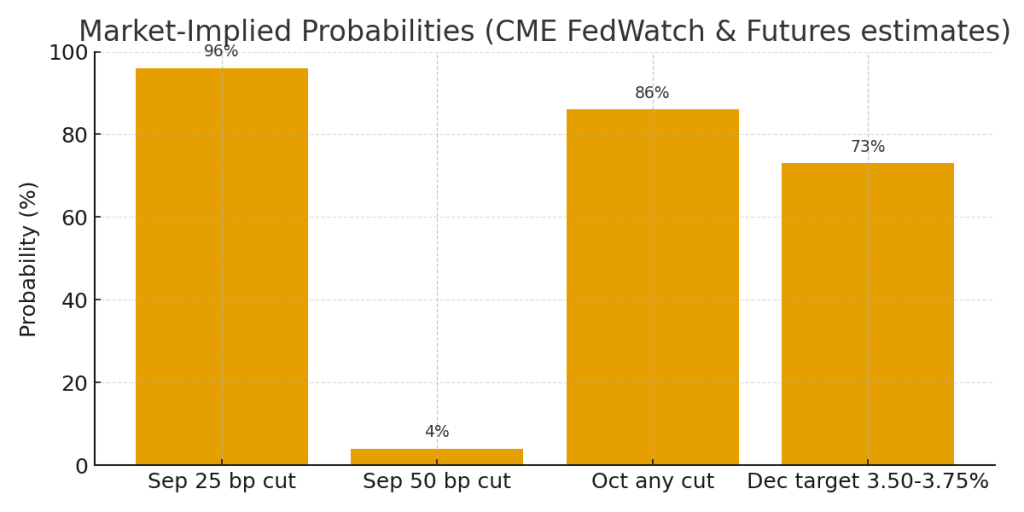
PCE inflation, the Fed’s preferred measure, is now projected to hit 3.6% in 2026 with core at 3.3%. The median policymaker expects tightening by year-end. Markets are now pricing a coin-flip probability of a rate hike by October and nearly 67% odds of one by December.
In this environment, the math on high-multiple technology stocks is straightforward and unflattering. Higher rates mean higher discount rates. Higher discount rates mean future earnings are worth less today. The stocks that ran hardest on the AI narrative — the ones trading at 50x, 80x, even 100x forward earnings — face the steepest revaluation.
The dichotomy playing out in real-time today illustrates this perfectly. Memory chips (MU, QCOM, AMD) have near-term, tangible, rapidly growing earnings from AI infrastructure spending. They are somewhat insulated from rate-driven multiple compression because their growth is so explosive that valuation math almost doesn’t apply in the conventional sense. Consumer tech (AAPL, MSFT, GOOGL, META, AMZN) carries premium valuations built on predictable but moderate growth — exactly the profile that suffers most when rates rise.
What the Institutional Put Flow Is Saying
What the Institutional Put Flow Is Saying
Perhaps the most telling signal of the day came from the options market, where Unusual Whales flagged a cascade of notable bearish prints in SPY that paint a clear picture of institutional positioning.
The headline trades:
- SPY $740P 7/17/26 — $32.7M, 25,000 contracts, hit on the ask. A deep ITM put expiring in 22 days with near-delta-1 exposure. This is not a speculative play — it is the economic equivalent of a $32.7M short stock position with defined risk and no borrow cost.
- SPY $750P 8/21/26 — $58.6M, floor-style print. Deeper ITM, longer dated. Classic portfolio hedge structure — someone protecting a large long book against meaningful downside over the next two months.
- SPY $725P 9/18/26 — $768K, ask-side. Further OTM, 85 days out. Smaller in notional but the September expiration is notable — this is tail risk protection, not a near-term directional bet.
Combined, those three prints represent over $92 million in bearish SPY exposure layered across three separate expiration windows: July, August, and September.
Alongside the big prints, Unusual Whales flagged repeated hits in same-day and next-day contracts clustered around the 733, 735, 736, and 737 strikes — the exact levels that acted as resistance all morning after the opening flush. That kind of repeated hitting at specific strikes is consistent with dealers and active traders pressing known resistance rather than adding new directional exposure.
One counterpoint worth noting: there were repeated hits on the SPY $735C 6/26/26 — tomorrow’s expiration — but the flow was predominantly bid-side premium. Bid-side call flow is the opposite of bullish conviction; it suggests sellers are writing calls into the bounce, not buyers chasing upside. The call flow, in other words, reinforces the bearish read rather than complicating it.
Deep ITM puts with near-delta-1 exposure are not lotto plays. They are used by institutions to hedge large long equity portfolios without the cost and complexity of borrowing shares. The choice to layer across July, August, and September expirations is deliberate — this is not a one-event hedge. Someone with serious capital is building a structured bearish position that survives multiple catalysts: the next FOMC meeting, Q2 earnings season, and any further PCE or labor market data.
The timing — placed into a PCE-driven relief rally on a day when SPY briefly touched 739 — makes the conviction clear. These are not panic trades placed at the low. They are distribution trades placed into strength.
The Divergence That Defines This Market
Zoom out and the picture snaps into focus. The AI infrastructure buildout is real — Micron’s $41 billion quarter proves it beyond any reasonable doubt. The companies supplying the picks and shovels of that buildout (memory, equipment, networking) are printing record results and will likely continue to do so.
But the companies selling software, services, subscriptions, and consumer devices into an economy where the Fed may be about to raise rates are facing a very different calculus. The assumption that powered the 2024–2025 tech rally — that rate cuts were coming and growth would be rewarded — has been invalidated. The new assumption, increasingly priced into the options market and into institutional positioning, is that rates stay higher for longer and that the valuation premium for big tech needs to compress.
Today’s session was a preview of what that compression looks like in real time: AAPL -6%, MSFT -3.5%, META -1.7%, the broad tape red — while the semiconductor supply chain quietly moved higher on the back of the most profitable memory chip quarter in history.
The AI trade is not over. But the everything-tech rally almost certainly is.
Market analysis provided by The Macro Compass is for informational purposes only. Please consult with a financial advisor before making investment decisions.