PCE Preview: Will May’s Inflation Print Seal the Deal on a Fed Hike?

Wednesday, June 24, 2026

Tomorrow morning at 8:30 a.m. EDT, the Bureau of Economic Analysis drops the May Personal Consumption Expenditures (PCE) report — the Federal Reserve’s preferred inflation gauge and markets are on edge. With a hawkish new Fed chair, a Middle East conflict still casting a shadow over energy prices, and rate-hike odds climbing by the day, this print could be the most consequential inflation release of the year.


What Economists Are Expecting

Wall Street is bracing for a hot number. The consensus, per FactSet, calls for:

  • Headline PCE: +0.5% month-over-month (up from +0.4% in April), rising to 4.1% year-over-year (from 3.8% in April)
  • Core PCE (ex-food & energy): +0.37% month-over-month (up from +0.24% in April), holding at 3.3% year-over-year

Bank of America, Goldman Sachs, and UBS are all clustered around these figures, which they note largely reflect what was already telegraphed by the May CPI and PPI data. UBS is projecting headline PCE at 4.10% YoY with core at 3.45%.

The driver is no mystery: energy. West Texas Intermediate crude surged from roughly $57/barrel at the start of 2026 to a peak of $113/barrel in April, driven by the conflict in Iran and the closure of the Strait of Hormuz. While oil prices have pulled back to around $74-76/barrel more recently, the May data captures a period of still-elevated fuel costs and that flows directly into headline PCE.


The Bigger Picture: A Fed at an Inflection Point

This report lands one week after Fed Chair Kevin Warsh’s first FOMC meeting, which markets widely interpreted as a hawkish turn. The June dot plot showed nine of eighteen officials penciling in at least one rate hike before year-end, erasing the prior expectation of a cut. The Fed’s median projection for year-end PCE inflation was revised up sharply to 3.6% for headline and 3.3% for core — both well above the 2% target.

The funds rate currently sits at 3.5%–3.75%, where it has been since late 2025 cuts. After Warsh’s press conference, CME FedWatch odds of at least one hike by year-end jumped dramatically, with traders now eyeing a move as early as October.

A hot PCE print tomorrow would pour fuel on those expectations.


The Iran War: The Inflation Variable No Model Fully Captures

Research from the Dallas Fed shows that the Strait of Hormuz closure has added meaningful upside to PCE inflation in 2026, with estimates of an additional 0.40–1.25 percentage points to Q4/Q4 headline PCE depending on the duration of the disruption. Core PCE has been less directly affected. But the longer supply chains remain stressed, the more the shock bleeds into broader prices.

There is, however, a potential silver lining: reports emerged this past weekend of a US-Iran peace agreement, and markets have already begun to price in some relief. Gasoline prices are down roughly $0.56/gallon from their May 20th peak, which should cool June’s headline PCE meaningfully. UBS and others expect May to mark the peak for headline PCE inflation this year.


What Would Move Markets

Hotter than expected (>4.2% YoY headline, >3.4% core YoY): Expect a further rise in short-term Treasury yields, dollar strength, and pressure on equities — especially rate-sensitive sectors like tech and real estate. Rate-hike odds for October and December would spike.

In-line with consensus (~4.1% headline, ~3.3% core): A measured reaction. Markets may view it as “bad but known.” The hike narrative stays intact but doesn’t accelerate.

Cooler than expected (<3.9% headline, <3.1% core): A relief rally in equities, some bond buying, and a modest repricing of hike odds. The Fed would still face pressure to tighten eventually, but the urgency fades.


The Fed’s Dilemma in Plain Terms

Warsh’s Fed inherited an economy with a resilient labor market — nonfarm payrolls added 172,000 jobs in May, with unemployment steady at 4.3% — but with inflation running far above target. Professional forecasters surveyed by the Philadelphia Fed put Q4/Q4 headline CPI inflation at 3.5% for 2026. Core PCE YoY has climbed from 3.0% in December 2025 to 3.3% in April 2026.

As Bank of America put it: “Overall, this would be a good number for the Fed, but it’s hard to take too much signal, given the uncertainty tariffs pose around the inflation path.” Add in the Iran war premium, and the Fed is navigating a fog of supply-side shocks that monetary policy alone can’t cure.


Bottom Line

Tomorrow’s PCE is not just an inflation reading — it’s a referendum on whether the Fed has more work to do. With the dot plot already pointing toward hikes, a print near consensus keeps the October hike in play. A beat to the upside could accelerate that timeline and rattle equity markets heading into the back half of the year.


Market analysis provided by The Macro Compass is for informational purposes only. Please consult with a financial advisor before making investment decisions.

The Fed Is Done Being Patient: What Three Rate Hikes Could Mean for Your Money

After five years of tolerating inflation above its 2% target, the Federal Reserve appears to be running out of patience and Wall Street is starting to take notice.

Bank of America made a striking call this week: the Fed will raise interest rates three times before the end of 2026, pushing the benchmark rate from its current 3.5%–3.75% range up to 4.25%–4.5%. That’s a sharp reversal from BofA’s previous forecast, which had rates staying flat all year.

How We Got Here

It wasn’t that long ago that the Fed was cutting rates. In December 2025, policymakers lowered the federal funds rate by a quarter point as job data softened and officials believed Trump’s tariffs would have only temporary inflationary effects. The plan was to hold steady and see.

Then things changed — fast.

The labor market bounced back stronger than expected. The U.S. war with Iran sent oil prices surging. And inflation, rather than cooling, got measurably worse. Core PCE (the Fed’s preferred inflation gauge) is on pace to hit 3.5% — nearly 70 basis points higher than a year ago. Housing-driven disinflation, which had been quietly helping keep prices in check, has largely run its course. Other core services? Still very sticky.

In short: the Fed’s best-case scenario didn’t play out.

The Warsh Factor

New Fed Chairman Kevin Warsh has added a hawkish edge to all of this. At the June FOMC meeting, half of policymakers penciled in rate hikes — even without expecting unemployment to fall. That’s unusual. Typically, the Fed tightens when the labor market is running too hot. The fact that officials are considering hikes regardless suggests a harder line on inflation itself.

Warsh also made a candid admission at his press briefing: it’s hard to call monetary policy “restrictive” while watching Wall Street raise trillions in new stock and debt offerings. Financial conditions, he suggested, aren’t quite as tight as the rate numbers imply.

BofA now sees the first hike coming in September, with two more following in October and December.

Not Everyone Agrees

To be fair, there’s a credible counterargument. Alpine Macro’s chief global strategist Chen Zhao thinks actual rate hikes are unlikely. His reasoning: if the Iran war winds down, oil could fall back to $50–$60 a barrel, pulling inflation lower with it; small businesses are struggling; AI is boosting productivity; wage growth is cooling.

Zhao’s view is that the inflation spike is mostly transitory and that once these one-off shocks pass, the Fed won’t need to act.

What This Means for You

Markets are already moving. The 10-year Treasury yield jumped this week even as crude oil prices fell. Investors are pricing in a more aggressive Fed.

For consumers and businesses, the stakes are real. Higher rates mean:

  • Mortgages and auto loans get more expensive — or stay expensive longer than expected
  • Credit card rates stay elevated, squeezing household budgets
  • Business borrowing costs rise, potentially slowing hiring and investment

If BofA is right, the brief window of rate relief that opened in late 2025 will close entirely by year’s end.

The Bottom Line

The Fed spent years threading the needle — tolerating above-target inflation while keeping the economy afloat through tariff shocks and global uncertainty. That era may be ending. Whether it’s three hikes or none, the message from policymakers is increasingly clear: inflation has overstayed its welcome, and the Fed’s patience has a limit.

The next few months will tell us whether that limit has been reached.


Sources: Fortune, Bank of America research note, Alpine Macro.


Market analysis provided by The Macro Compass is for informational purposes only. Please consult with a financial advisor before making investment decisions.
Peace Dividend: What the U.S.-Iran MOU Means for Markets From Here

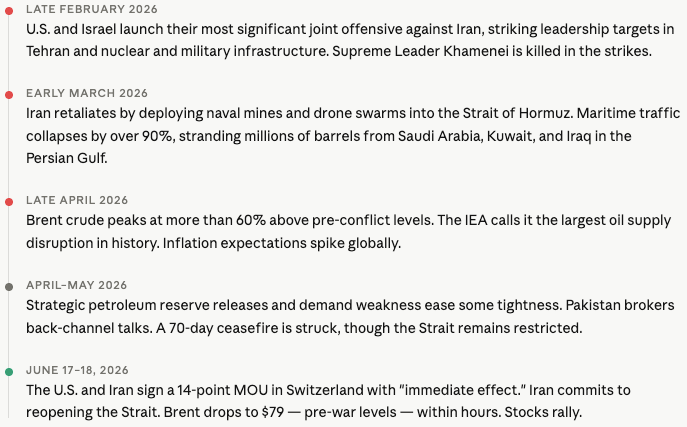
After four months of conflict that rattled energy markets, shuttered the world’s most critical oil chokepoint, and sent inflation surging, a 14-point memorandum of understanding (MOU) is officially on paper. Now comes the harder question: what does it actually change?

How we got here
What changed: we now have the actual text

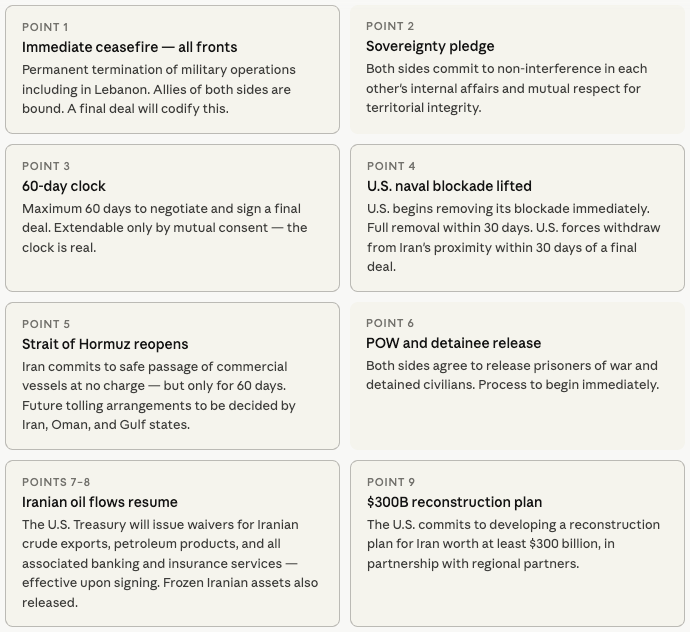
For days after President Trump announced the deal at the G7 in Evian, markets were trading on optimism without details. That changed Wednesday, when senior U.S. officials read the full 14-point text to reporters. Iran’s government subsequently published it on X, with both versions matching. Here’s what the MOU actually says — and what it means for your portfolio.

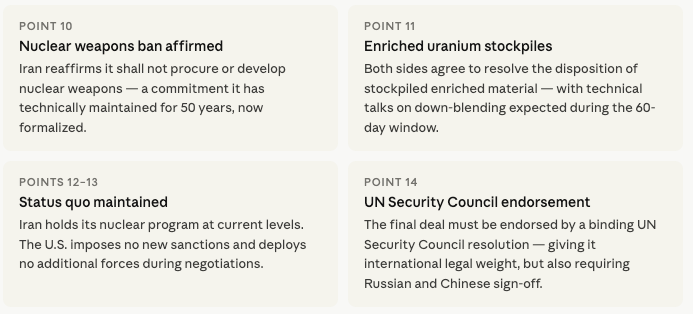
The 14 points, broken down
The line that defines the deal’s shelf life

“If it doesn’t get done in 60 days, that’s all right. We go back to bombing. I don’t want to do that, because it’s so good, but we might have to.”

— President Trump, G7 press conference, Evian, June 17, 2026

That quote is the single most important variable for market pricing right now. The 60-day window is both a countdown and a gun. Every week of productive nuclear talks should be modestly bullish for risk assets; any sign of breakdown is a swift, sharp risk-off trigger.

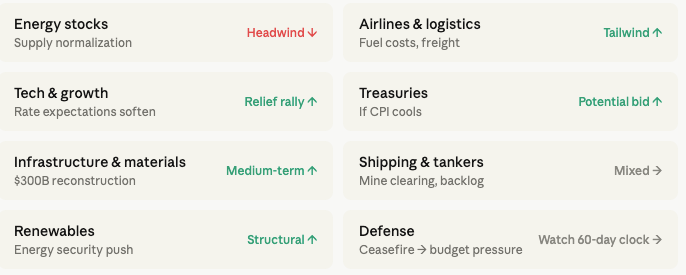
What the MOU means for markets — point by point

The most immediate market mover is Point 5 combined with Points 7 and 8. The Strait reopening plus the Treasury waivers on Iranian oil exports means meaningful supply is returning to the market essentially overnight. Brent has already fallen back to $79, erasing the entire conflict premium. With the IEA having called this the largest oil supply disruption in history, the reversal is equally historic in speed.

Point 9 — the $300 billion reconstruction commitment — is less discussed but potentially significant for construction, infrastructure, and industrial materials sectors. If talks succeed and a final deal unlocks that spending, it’s a meaningful demand signal for commodities like steel, cement, and copper, as well as for defense and engineering contractors with Middle East exposure.

The toll-free Strait access is notable for one key reason: it’s explicitly limited to 60 days. After that, future administration of the waterway falls to Iran, Oman, and Gulf states. U.S. officials claim Gulf states will never agree to tolls, but markets should price in some ongoing uncertainty premium around Hormuz access until a final deal settles this permanently.

Point 14‘s UN Security Council requirement is the sleeper risk. Russia and China hold vetoes. If the final deal drifts in a direction either finds unfavorable, the endorsement pathway becomes complicated — and a deal without it may have less legal durability than markets assume.

The Fed angle — does this flip the dot plot?

Yesterday’s dot plot showed nine FOMC members favoring rate hikes, with the median projection jumping to 3.8% — driven explicitly by energy-driven inflation from the conflict. If oil holds near $79 and Iranian supply normalizes over the coming weeks, the inflation data will begin to reflect that, likely starting with July’s CPI release.

That doesn’t mean hikes are off the table — the Fed is watching core inflation too, and second-round energy effects can be sticky. But the directional pressure on the dot plot changes materially. A deal that holds could shift the median projection back toward hold, or even eventually toward cuts, well before the end of 2026.

Sectors and assets to watch
Bottom line

The MOU is more substantive than many expected. Oil sanctions relief is immediate, the Strait reopens now, and Iran gets a credible path to sanctions removal and reconstruction funding. In exchange, the nuclear weapons commitment is reaffirmed and technical talks on enriched stockpiles begin.

The core risk hasn’t changed: this is an interim agreement with a hard expiration. The 60-day clock is ticking. A final deal requires resolving Iran’s nuclear program, U.S. sanctions, regional security arrangements, and UN endorsement — none of which are simple. But for now, the market has a genuine reason to reprice the conflict premium out. Whether that holds depends entirely on the Swiss negotiating table over the next two months.

Watch the July CPI print. Watch the nuclear talks timeline. And keep one eye on the 60-day expiry date: August 18.


Market analysis provided by The Macro Compass is for informational purposes only. Please consult with a financial advisor before making investment decisions.
The Fed’s Dot Plot Just Flipped the Script — Hikes Are Back on the Table

For the first time in years, policymakers are signaling rate increases rather than cuts. Here’s what the June 2026 projections mean for markets and the economy.


What the dot plot shows

The Federal Reserve’s June 2026 Summary of Economic Projections landed with a jolt. Where the March dot plot still penciled in rate cuts for this year, the latest projections tell an entirely different story: not only are cuts off the table, but nearly half of the Fed’s voting members now see rates going higher before the year is out.

The median fed funds rate projection for year-end 2026 jumped to 3.8%, a meaningful 40-basis-point revision from March’s 3.4%. More striking than the median, however, is the distribution beneath it.

How officials voted

Nine of the 18 participating officials now favor at least one rate hike before the end of 2026. Six of those nine see multiple hikes as appropriate. Only one lone voice still projects a cut.

What’s driving it

The answer is inflation — specifically, an inflation picture that has deteriorated significantly since the spring. The Fed raised its 2026 PCE inflation forecast to 3.6%, up sharply from 2.7% in March. Core PCE followed suit, climbing to 3.3% from 2.7%. Officials attributed much of the move to energy-driven price pressures tied to the ongoing conflict in the Middle East.

“If this dot plot turns out to be the last, markets will have lost their clearest window into Fed thinking — just as the path becomes harder to read.”

On the growth side, the picture is more mixed. GDP projections for 2026 were trimmed modestly to 2.2% from 2.4%, while the unemployment rate outlook was little changed at 4.3%. Inflation is the dominant concern; growth and employment remain resilient enough to give hawks cover.

The Warsh wildcard

Perhaps the biggest subplot of Wednesday’s meeting was what wasn’t in the dot plot: new Fed Chair Kevin Warsh’s own projections. Warsh declined to submit a dot, citing long-held personal views about the exercise. He then raised eyebrows further by announcing a communications task force to review the Fed’s overall strategy — including, explicitly, whether the dot plot should continue to exist at all.

EY-Parthenon’s chief economist Gregory Daco flagged to Yahoo Finance that this could be the last dot plot markets ever see. If so, investors would lose one of their primary tools for gauging where rates are headed — a significant shift in how central bank policy gets communicated.

Bottom line

The rate-cut narrative that dominated early 2026 is now definitively over. The question has shifted from when will the Fed ease? to will the Fed have to tighten again? How quickly inflation data responds to the Middle East situation — and whether Chair Warsh develops his own public stance on rates — will determine which of those 18 dots proves closest to reality.


Market analysis provided by The Macro Compass is for informational purposes only. Please consult with a financial advisor before making investment decisions.
Warsh’s First Test: What to Expect From Tomorrow’s FOMC Meeting

Tomorrow, June 17, brings the conclusion of the June 16–17 FOMC meeting, and it carries an unusual amount of weight for a gathering where almost nobody expects the headline number to change. This is the first Federal Open Market Committee meeting led by Kevin Warsh since the Senate confirmed him as Fed chairman in a historically close 54-45 vote on May 13, and since he was sworn in on May 22. Markets that spent the Powell era learning to read one chair’s signals are now starting from scratch with another, and that alone makes this meeting worth watching closely even though the rate decision itself is close to a foregone conclusion.

The backdrop Warsh is walking into

Warsh inherits a genuinely messy moment. Inflation has been reaccelerating: May’s CPI report showed headline inflation up 0.5% on the month and 4.2% year-over-year, the fastest annual pace in three years, with core inflation running at 2.9%. At the same time, the labor market just delivered a hotter-than-expected May payrolls report, adding 172,000 jobs even as the unemployment rate ticked up to 4.3%. That combination — sticky inflation plus resilient job growth — is exactly the kind of data that makes a “transitory, so let’s cut” argument hard to sustain.

Layered on top of that is the Iran war, which spent the spring pushing energy prices higher and adding a geopolitical inflation premium to everything from gasoline to shipping costs. The encouraging twist heading into this meeting is that a framework to end the conflict was announced just this week, sending oil prices lower and global stock markets sharply higher on Monday. That’s a meaningful tailwind for the Fed’s inflation outlook, but it’s also brand new, and officials will likely want more than a few days of calm before declaring the energy shock over.

Then there’s the political overlay. President Trump pushed hard for Warsh’s nomination specifically because he wanted a Fed chair who would cut rates, and as recently as this past weekend Trump was publicly arguing there’s “no reason” to raise rates. But the data Warsh is actually looking at — hot inflation, a still-strong labor market — points the other way. That tension between the president who appointed him and the numbers in front of him is arguably the real story of this meeting.

What’s actually likely to happen

On the rate decision itself, there’s broad consensus: CME FedWatch pricing has put the odds of a hold at the existing 3.50%–3.75% range above 95%, and a recent Reuters poll found the large majority of surveyed economists expect no change through the rest of 2026. A rate move tomorrow would be a genuine surprise.

What’s far less settled is everything around the decision. June is one of four meetings this year that comes with an updated Summary of Economic Projections — the “dot plot” — so officials will be putting fresh numbers on where they expect rates, growth, and inflation to land by year-end. Several analysts, including strategists at J.P. Morgan Wealth Management and Schwab’s Center for Financial Research, expect the committee’s policy language to shift from an easing bias toward something closer to neutral, formally acknowledging that the inflation data doesn’t support more cuts right now. Some options pricing has even priced in a meaningful chance of a hike before year-end, though that’s a minority view and a notable departure from where things stood a few months ago.

Then there’s Warsh himself. He’s been an outspoken critic of the Fed’s communication style under his predecessors and has signaled a preference for a leaner institution that talks less and relies less on detailed forward guidance. His 2:30 p.m. press conference will be the first real test of that philosophy in practice, and economists like Wharton’s Jeremy Siegel have suggested the framework and tone Warsh sets here may end up mattering more than the rate decision itself. The double bind he’s in is real: lean hawkish and risk a public rebuke from the president who picked him; lean dovish and risk looking like he’s bending to political pressure rather than the data, undermining credibility with the bond market right out of the gate.

Forecast: rates neutral, markets a coin flip leaning slightly positive

For the rate decision itself, the call is straightforward: neutral. A hold at 3.50%–3.75% is close to certain, and that part of tomorrow’s announcement shouldn’t move markets much on its own.

For how markets react to the meeting as a whole, the lean is neutral to modestly positive, with wide uncertainty. The Iran ceasefire framework has already put risk appetite in a good mood heading in, and a “steady hands, no surprises” rate decision combined with a chair who avoids over-committing to either a hawkish or dovish path would likely be read as a relief rather than a shock. The bigger risk sits in the dot plot and the press conference: if the median dot shifts toward fewer cuts than markets had been pricing, or if Warsh’s tone reads as more hawkish than expected, that’s the scenario that could turn a quiet meeting into a volatile one for both stocks and the 10-year Treasury yield.

This is a forecast, not financial advice. Fed-day reactions are notoriously hard to call given how much hinges on word choice in a single press conference. Worth watching closely either way.


Market analysis provided by The Macro Compass is for informational purposes only. Please consult with a financial advisor before making investment decisions.

End of an Era: Markets Brace for Powell’s Final Act Amid Inflation Storm

The financial world is fixated on Washington this week for the Federal Reserve’s April 28–29 policy meeting. While the headline rate decision is almost certain to be a “no-change” at 3.50%–3.75%, the subtext is anything but quiet.

Between the energy price shocks from the Middle East conflict and a looming leadership change from Jerome Powell to Kevin Warsh, investors are navigating a “perfect storm”. Recent data showing inflation surging to 3.3% has effectively erased hope for near-term relief, forcing Wall Street to accept that rates will likely stay “higher for longer”.

For markets, the real volatility won’t come from the 2:00 PM statement, but from Powell’s final press conference. Will he use his swan song to cement a hawkish legacy against rising prices, or will he maintain a neutral stance to hand over a stable economy to his successor? One thing is certain: with a 100% market consensus for a pause, any deviation in tone will cause immediate ripples across the S&P 500 and the U.S. dollar.


The Federal Open Market Committee (FOMC) is widely expected to keep interest rates unchanged at its April 29, 2026, meeting, maintaining the federal funds target range at 3.50%–3.75%. Market sentiment has shifted significantly due to rising inflation and geopolitical uncertainty, with traders now pricing in a nearly 100% probability of a third consecutive pause.

FOMC Meeting Forecast: April 29, 2026

  • Rate Decision: A “virtual lock” to hold rates steady.
  • Inflation Pressures: Consumer Price Index (CPI) inflation jumped to 3.3% in March from 2.4% in February, driven largely by skyrocketing energy costs related to the ongoing war in Iran.
  • Leadership Transition: This is likely to be Jerome Powell’s final meeting as Chair before his term expires on May 15. Kevin Warsh is expected to be his successor.
  • Forward Guidance: Experts anticipate the Fed will adopt a “wait-and-see” approach, with some officials potentially signaling a hawkish pivot (discussing future rate hikes) if inflation remains unanchored.

Market Impact Analysis

  • Equities: Stocks have recently shown vulnerability due to the removal of anticipated rate cuts from the 2026 outlook. A hawkish tone from Powell could further pressure high-growth sectors like AI infrastructure.
  • Fixed Income: Markets are now pricing in a “prolonged holding pattern,” with CME’s FedWatch tool showing zero expectation of a cut this month.
  • Currencies: The U.S. Dollar Index (DXY) is currently testing key technical levels near its 200-day moving average; a focus on inflation risks during the press conference could trigger a hawkish rally.

Market analysis provided by The Macro Compass is for informational purposes only. Geopolitical events are highly volatile; please consult with a financial advisor before making investment decisions based on conflict-related data.

Why the Fed Might Hike Rates Next — Even When Everyone Expected Cuts

For most of 2026, the narrative seemed straightforward: inflation was cooling, the labor market was stabilizing, and the Federal Reserve would likely begin cutting interest rates.

That narrative is now… shaky.

A mix of geopolitical shocks, stubborn inflation signals, and a still-resilient labor market has forced investors—and the Fed—to reconsider. What once looked like a clear path to easing policy has turned into a “wait… could they actually hike again?” moment.

Let’s break down why.


1. Geopolitical Tensions Are Reigniting Inflation

The biggest wildcard right now is geopolitics—specifically the escalating conflict involving Iran and disruptions in global energy markets.

Oil prices have surged sharply due to supply concerns, with key shipping routes like the Strait of Hormuz under threat. That matters because energy costs ripple through everything: transportation, food, manufacturing, and ultimately consumer prices.

  • Oil shocks historically feed directly into inflation
  • Higher energy costs reduce consumer spending power
  • Businesses pass increased costs onto consumers

Fed officials are already warning that prolonged disruptions could push inflation higher again and shift expectations—one of the Fed’s biggest fears.

And here’s the problem: the Fed cannot cut rates into rising inflation. If anything, it may need to lean the other way.


2. The Market Has Rapidly Repriced Rate Expectations

Just weeks ago, markets were pricing in multiple rate cuts for 2026.

Now? That’s changed dramatically.

  • Treasury yields have surged
  • Borrowing costs are rising across the economy
  • Markets are increasingly pricing out cuts—and even considering hikes

This shift is being driven largely by inflation fears tied to geopolitics and commodity prices.

In other words, the bond market is starting to say:
“Maybe policy isn’t restrictive enough anymore.”


3. Inflation Isn’t Fully Dead Yet

Even before geopolitical tensions escalated, inflation wasn’t exactly “mission accomplished.”

  • It remains above the Fed’s 2% target
  • Services inflation has been sticky
  • Commodity prices are rising again

Fed Governor Michael Barr recently emphasized that inflation is still elevated and may require rates to stay higher for longer.

Now layer on top:

  • Rising oil prices
  • Potential supply chain disruptions
  • Increased global risk premiums

Suddenly, inflation risks are no longer fading—they’re reaccelerating.


4. The Labor Market Isn’t Weak Enough to Force Cuts

If the job market were collapsing, the Fed would have a clear reason to cut rates.

But that’s not happening.

Instead:

  • Job growth is slowing, but still stable
  • Unemployment remains relatively low
  • Wage pressures haven’t fully cooled

This creates a tricky situation:
The Fed doesn’t have the “economic emergency” it would need to justify easing.

In fact, a stable labor market gives the Fed room to stay restrictive—or even tighten further if inflation re-emerges.


5. The Fed Is Stuck Between Two Risks

Right now, policymakers are dealing with a classic dilemma:

Risk #1:
Cut too early → inflation comes roaring back

Risk #2:
Stay too tight → trigger a recession

Add geopolitical uncertainty into the mix, and even Fed officials admit they’re essentially “driving through a fog.”

That uncertainty is exactly why the idea of a rate hike—once unthinkable this year—is now being discussed again.


6. So… Will the Fed Actually Hike?

Let’s be real: a hike is still not the base case.

Most forecasts still lean toward:

  • Holding rates steady in the near term
  • Possibly cutting later in the year

But the key shift is this:

👉 A hike is no longer off the table.

If the following happen:

  • Oil stays elevated
  • Inflation ticks higher
  • The labor market remains resilient

…then the Fed may have no choice but to consider tightening again.


Final Thoughts

The market went from confidently expecting rate cuts… to questioning whether policy is tight enough.

That’s a big shift—and it happened fast.

Right now, the Fed’s next move isn’t just about economic data. It’s about how multiple forces collide:

  • Geopolitics driving energy prices
  • Inflation proving stubborn
  • Labor markets refusing to crack

The result?

A central bank that was preparing to ease… now forced to stay cautious—and possibly even turn hawkish again.

Markets Whipsaw as Hot PPI Meets Fed Pause: What Today’s Data Really Means

Today delivered a one-two punch for markets: a closely watched Producer Price Index (PPI) report in the morning, followed by the Federal Reserve’s FOMC decision in the afternoon.

The result? A volatile session that reflected a market struggling to reconcile persistent inflation with a cautious central bank.


📊 Morning Shock: PPI Reinforces Inflation Concerns

The day started with the release of the latest PPI data at 8:30 AM ET—a key measure of wholesale inflation.

Recent trends have shown PPI coming in hotter than expected, with prior readings around +0.5% month-over-month vs. +0.3% expected, and core components even stronger. (XTB Broker Online)

That matters because PPI often feeds into future consumer inflation (CPI).

Today’s takeaway:

  • Inflation pressures—especially in services—remain sticky
  • The idea of quick rate cuts is fading
  • Markets immediately leaned risk-off

Historically, strong PPI prints tend to push equities lower because they signal the Fed may need to keep rates higher for longer.


🏛️ Afternoon: Fed Holds Rates, But Tone Matters

Later in the day, the Federal Open Market Committee (FOMC) announced its rate decision.

As expected, the Fed held rates steady in the 3.50%–3.75% range. (Wikipedia)

But the decision itself wasn’t the story—the messaging was.

Markets were focused on:

  • Future rate cut timing
  • Inflation outlook
  • Economic projections

Coming into the meeting, expectations were already shifting toward fewer or later rate cuts, especially after recent inflation data. (GO Markets)


📉 Market Reaction: A Tug-of-War Between Inflation and Policy

The market reaction today can be summed up in one word: conflicted.

After PPI:

  • Stocks moved lower
  • Yields and inflation fears rose
  • Rate-cut expectations were pushed further out

After FOMC:

  • Initial reaction depended on interpretation of Fed tone
  • Markets attempted to stabilize, but conviction remained low

This creates a classic push-pull dynamic:

  • Inflation data → bearish (higher rates longer)
  • Fed pause → mildly supportive (no immediate tightening)

⚡ The Bigger Picture: Why Today Matters

Today wasn’t just about one data point or one Fed meeting—it highlighted a broader market theme:

👉 The last mile of inflation is proving difficult.

  • Goods inflation is easing
  • Services inflation remains sticky
  • Energy prices (partly due to geopolitical tensions) add uncertainty

This combination makes the Fed’s job harder and keeps markets on edge.


🔮 What Comes Next

Markets are now recalibrating around a few key questions:

  • Will inflation stay elevated longer than expected?
  • Are rate cuts being pushed into the second half of the year?
  • Can the economy handle higher rates without slowing sharply?

Expect:

  • Continued volatility around economic data releases
  • Increased sensitivity to inflation prints
  • More choppy, headline-driven trading

✅ Bottom Line

Today’s market action reflects a simple but powerful reality:

  • Inflation is not fully under control
  • The Fed is in wait-and-see mode
  • Markets are adjusting to “higher for longer”

Until there is clearer evidence that inflation is cooling, expect markets to remain reactive, volatile, and highly data-dependent.

Intro to Kevin Warsh

Let do a deep dish into Kevin Warsh — not the bio stuff, but how he thinks, how markets would re-price under him, and why people are split.


Kevin Warsh: Deep Dive 🧠📊

1️⃣ His core worldview (this matters more than labels)

Warsh is often described as an inflation hawk, but that’s incomplete.

A better framing:

He’s a credibility hawk.

He believes:

  • The Fed lost credibility by staying too loose for too long
  • Balance sheet expansion distorted markets
  • Monetary policy became a substitute for fiscal discipline (which he hates)

He’s less obsessed with today’s CPI print and more worried about:

  • Long-term inflation expectations
  • Dollar credibility
  • Political capture of the Fed

2️⃣ His biggest break with Powell-era Fed

Warsh vs Powell in one sentence:

  • Powell: “We’ll adjust policy as data evolves”
  • Warsh: “Policy mistakes come from bad frameworks, not bad data”

What Warsh dislikes:

  • QE becoming “normal”
  • Emergency tools used in non-emergencies
  • Forward guidance that locks the Fed into corners

He’s publicly criticized:

  • The size of the Fed’s balance sheet
  • The belief that inflation was “transitory”
  • The Fed’s communication becoming political theater

3️⃣ Is he really dovish now?

This is the trickiest part — and where markets can misread him.

Here’s the nuance:

Warsh can support lower rates if:

  • Inflation expectations are anchored
  • Fiscal policy is credible
  • The Fed regains institutional authority

But he hates cutting rates:

  • To support asset prices
  • To finance deficits
  • To bail out bad fiscal policy

So:

He is not dovish by default — he’s conditional.

This is very different from how markets currently price Fed behavior.


4️⃣ Treasury–Fed “coordination” (this is the controversy)

Warsh has floated the idea of a new Treasury-Fed Accord.

Supporters say:

  • Better crisis coordination
  • Less policy confusion
  • Clearer division of labor

Critics hear:

  • Reduced Fed independence
  • Political pressure on rates
  • Debt monetization risk

Markets would immediately ask:

“Is the Fed still the adult in the room?”

This is the single biggest market risk if Warsh becomes Chair.


5️⃣ What markets would do under a Warsh Fed

📉 USD (initially volatile, then stronger)

Short term:

  • FX volatility
  • Some concern about independence

Medium term:

  • USD likely stronger
  • Warsh prioritizes credibility + inflation expectations
  • Less tolerance for persistent negative real rates

Think:

Less structural USD bleed, more discipline.


📈 Rates & bonds

This is where the biggest repricing happens.

  • Short end: more policy uncertainty
  • Long end: depends on credibility

If markets believe:

  • Warsh reins in QE
  • Forces fiscal discipline indirectly

👉 Long-term yields could fall despite tighter rhetoric.

If not?
👉 Term premium explodes.


📉 Stocks

  • Short-term: choppy, multiple compression risk
  • Long-term: healthier market structure

Tech:

  • Loses some “Fed put” premium
  • But benefits if USD stabilizes and inflation risk drops

Small caps:

  • More vulnerable (less balance sheet resilience)

🥇 Gold

Gold’s reaction to Warsh is fascinating:

  • If Warsh restores Fed credibility → gold down
  • If Treasury–Fed coordination looks political → gold rips

Gold becomes a confidence barometer, not just inflation hedge.


6️⃣ Why Trump likes Warsh (important context)

This isn’t just about rates.

Warsh:

  • Understands markets deeply
  • Communicates clearly (investors respect him)
  • Criticizes Fed bureaucracy without sounding reckless

Trump:

  • Wants lower rates
  • Wants someone who looks credible
  • Wants someone markets won’t instantly revolt against

Warsh is the “respectable regime change” candidate.


7️⃣ Senate confirmation risk

This won’t be smooth.

Expect questions on:

  • Fed independence
  • Coordination with Treasury
  • Views on QE and crisis tools

Markets will trade:

  • Confirmation odds
  • Tone of testimony
  • First hints about balance sheet policy

This process alone can move:

  • USD
  • Gold
  • Long bonds

8️⃣ Big picture: why Warsh matters right now

This is happening at a fragile moment:

  • USD already weakening
  • Deficits exploding
  • Shutdown risk
  • Geopolitical stress
  • Markets addicted to liquidity

Warsh represents:

A possible pivot away from “liquidity-first” policy.

That’s why:

  • Some investors are excited
  • Some are deeply nervous

Bottom line (the honest take)

If Warsh becomes Fed Chair:

✅ Pros:

  • Stronger institutional credibility
  • Less policy drift
  • Better inflation anchoring
  • Potential USD stabilization

⚠️ Risks:

  • Market tantrums
  • Reduced Fed flexibility
  • Political pressure optics
  • Mistiming tightening in a fragile economy

He’s not a chaos candidate, but he would force markets to grow up a bit.


Will the Feds Hold Interest Rates Steady?

Here’s the current consensus around U.S. Federal Reserve interest rate expectations — are markets expecting the Fed to hold rates steady or cut them? The answer is both in different time frames, and the context matters a lot:

🔹 Short-term outlook (next Fed meeting)

  • The Fed is widely expected to hold interest rates steady at the upcoming January 2026 meeting, with no cut announced right now. (Investopedia)
  • Fed officials are signaling they want to keep policy focused on data, not politics, and aren’t likely to cut this week. (AP News)
  • Wall Street commentary also suggests policymakers are more cautious than aggressive on rate moves right now. (Morningstar)

Bottom line: Hold expected at current levels (often cited around 3.5–3.75% as of the latest cycle). (Trading Economics)


🔸 Medium-term view (through 2026)

Here, opinions diverge:

Markets still price in potential cuts later in 2026

  • Some economic projections (dot plots) have shown markets expecting one or two quarter-point cuts later this year as inflation cools. (Trading Economics)
  • A nonpartisan U.S. budget office report also projects a lower final rate by year-end 2026. (The Telegraph)

⚠️ But many economists now think cuts may not happen until later or not at all

  • Recent surveys of economists show most think the Fed will hold through at least the first quarter and possibly longer due to inflation still above the 2% target and continued moderate economic growth. (Investing.com)
  • Some major bank forecasts (e.g., JPMorgan) have shifted to expecting no rate cuts in 2026 and even a potential hike later if growth and jobs stay strong. (Reddit)

Why this divergence?

  • Inflation: still above the Fed’s 2% target in many measures.
  • Labor market: remains relatively tight in parts of the data.
  • Economic growth: decent enough that the Fed may not need to cut quickly.

📊 So what’s the practical expectation?

Here’s a simplified market consensus snapshot:

Time frameExpected Fed action
Next policy meeting (Jan 2026)Hold steady
1Q–2Q 2026Still likely hold; cuts not widely expected yet
Late 2026Some markets price possible cuts, but economists are mixed

🧠 Key drivers shaping expectations

No cut likely right now because:

  • Inflation remains elevated vs target.
  • Fed officials emphasize data dependency.
  • Economic resilience (especially jobs) reduces urgency for easing. (CBS News)

Cuts could still happen later if:

  • Inflation falls closer to target.
  • Growth slows meaningfully.
  • Labor market weakens.

🔎 What markets are currently pricing

Financial markets (via futures and yield curves) still reflect some probability of cuts by mid-late 2026 — but those odds have been pulled back recently as strong data and official comments push the expected timing later. (Trading Economics)


📌 Bottom line

Right now: The Fed is expected to hold rates steady at the next meeting.
Looking forward through 2026: There’s no strong consensus yet — market pricing suggests possible cuts later in the year, but many economists now think cuts may be delayed or may not come if inflation and growth stay firm.

Probability of Another Rate Cut and Market Outlook

Here’s a breakdown of the likelihood of another Federal Reserve rate cut and what that could mean for markets:


✅ Probability of Another Rate Cut

  • Market-based tools (like the CME Group FedWatch Tool) show ≈ 90%+ probability of a 25-basis-point cut at the next meeting (late October 2025).
  • Futures markets are also pricing in ~70–80 basis points of total cuts in 2025 after the already-announced September cut.
  • While a cut is very likely, there’s uncertainty about magnitude and timing beyond the next meeting; the Fed emphasizes it’s not on a “preset path.”

📊 Market Outlook Given Another Rate Cut

What the market is likely to do

  • Stocks: Growth stocks (especially tech and long-duration names) and rate-sensitive sectors (housing, REITs) may rally as borrowing costs decrease and future earnings look more valuable.
  • Bonds: Short-term yields should fall as the policy rate is cut; long-term yields may fall too if growth/ inflation fears dominate, which means bond prices rise.
  • U.S. Dollar: Likely to weaken somewhat — lower short-term interest rates reduce foreign-investor demand for USD-denominated assets.
  • Gold & safe assets: Could benefit as real yields (nominal yields minus inflation) drop, enhancing the appeal of non-yielding but inflation/allocation assets.
  • Commodities: May get a boost, especially if the cut is seen as pre-emptive and supports growth; but if the cut signals deepening economic weakness, commodities may falter.

Potential caveats & risks

  • If the cut is seen as a signal of economic weakness (rather than confidence) — e.g., labor market weak, growth faltering — then markets may start to worry about earnings declines and recession risk, which could offset the initial positive reaction.
  • If inflation remains sticky, the Fed may highlight caution about further cuts; growth/tech may lag if rate cuts appear insufficient to stimulate.
  • The magnitude of reaction may depend on communication: how the Fed frames forward guidance matters as much as the cut itself.

M2 Money Supply is at an all-time high and what this means

M2 money supply is at an all-time high (or reaching record levels), that’s a meaningful macro signal. Whether it’s “good” or “bad” depends heavily on other factors (velocity of money, inflation, growth, how the Fed responds). Here’s how to think about it, and what it could imply for markets:


🔍 What M2 Captures & Why It Matters

  • Definition: M2 is a broad monetary aggregate that includes currency in circulation, checking deposits, savings accounts, time deposits under $100,000, and certain money market funds.
  • Liquidity gauge: Because M2 includes funds that are relatively liquid, a high M2 signals there’s a lot of money “in the system” that could be deployed into spending, investment, or asset markets.
  • Theoretical link to inflation: Classic monetary theory (e.g. the Quantity Theory of Money) suggests that increases in money supply, if velocity is stable or rising, tend to lead to inflation—i.e. “too much money chasing too few goods.”

But in practice, that link is messy because velocity, credit conditions, and demand matter too.


⚠️ Caveats / Moderating Factors

  • Velocity of money is often declining — money may increase, but people might hold it rather than spend it.
  • Credit constraints / risk aversion can inhibit money from circulating (i.e., banks may not lend, businesses not invest).
  • Time lags: Money supply changes may take months or years to show up in inflation, growth, or asset prices.
  • Policy reaction: If inflation surprises, the Fed can tighten (or delay cuts), pulling back some of the effect.

📈 Market Impacts of High M2

If M2 is indeed at a record high, here are the likely ripple effects across markets (assuming other conditions like some inflation pressure and a somewhat stable growth environment):

Market SegmentExpected Reaction / RiskWhy
Equities (growth, small-cap, cyclical)Positive tailwindMore liquidity → more capital chasing returns → supports risk assets
Real estate / REITsFavorableMore money available for mortgage credit or property investment
Commodities / Inflation-linked assetsUpward pressureInflation expectations rise; commodity demand stronger
Bonds / YieldsHigher yields / yield curve steepeningMarkets may price in inflation, reducing bond prices
Dollar (FX)Potential weakeningMore money supply can devalue currency if inflation expectations shift upward

🧭 What It Means for the Fed and Policy

  • A high M2 gives the Fed less room to cut aggressively, because too much money in the system already threatens inflation overheating.
  • The Fed may lean more cautiously or even hold rates or tighten if inflation surprises upward.
  • If the Fed does cut, markets may interpret cuts more as acknowledging growth weakness rather than easing inflation — less uplift than expected.

Looking at recent data, there is support for the idea that the high M2 is pushing (or at least exerting pressure on) inflation, but it’s not a perfect one-to-one relationship. The relationship shows up more strongly over longer lags. Here’s what I found and how to interpret it:


📊 Recent M2 Growth & Inflation Metrics

Here are some specific figures and observations from recent data:

  • M2 Level & Growth
    • M2 (seasonally adjusted) in August 2025 was about $22,195.4 billion (≈ $22.20 trillion)
    • Over the past year, M2 has grown ~ 4.77% year over year
    • Month over month (Aug vs Jul) it rose by ~0.36%
  • Inflation / Price Metrics
    • The chart from LongTermTrends plots historical yearly M2 growth vs CPI inflation, showing that over many periods, M2 growth and inflation tend to move together (though with lag)
    • The St. Louis Fed’s analysis notes that historically, inflation has “followed” M2 growth with a lag (often 6–18 months), consistent with monetarist views.
    • The St. Louis Fed also emphasizes that the relationship has “long and variable lags” — meaning M2 expansion doesn’t immediately translate into inflation, but over time the pressure builds.
  • Recent Observations & Commentary
    • Some sources note that M2’s annual growth approaching ~5% is concerning, historically, from an inflation risk standpoint.
    • Finance sites report that M2 reached record highs (i.e. “U.S. M2 money supply hits record high of nearly $22T”) which underscores the magnitude of liquidity in the system.

🧠 Interpretation & What It Suggests

Putting those facts together, here’s how to interpret the signal:

  1. Lagged inflation risk is likely elevated
    The high M2 growth suggests there is more liquidity in the system. If velocity (the rate at which money circulates) picks up or remains stable, that liquidity can translate into demand-pull inflation. Because past studies show lags, inflation pressures may intensify in coming quarters.
  2. If inflation is already sticky, M2 adds fuel
    Given that inflation hasn’t fully normalized and there are ongoing pressures (trade, tariffs, labor costs), the elevated M2 offers more “ammunition” for inflation rather than being easily absorbed.
  3. Not a guarantee — context matters
    The fact that M2 growth is high doesn’t force inflation; other factors like weak demand, high capacity, tight credit, or falling velocity can mute the effect. Indeed, many economists argue that in modern banking/financial systems, the direct linkage between money aggregates and inflation is weaker than classical monetarist theory suggested.
  4. Policy constraints increase
    With M2 high, the Fed has less room to “loosen up” without risking overheating. If inflation surprises upward, the Fed might delay cuts or even tighten further — which creates more tension for markets.

✅ Bottom Line

  • A record-high M2 isn’t inherently bad — it could support growth and asset markets if other conditions are favorable.
  • But it raises a caution flag: the more money there is, the more sensitive markets become to inflation surprises or monetary tightening.
  • In the current climate — sticky inflation, weak labor, geopolitical risks — a high M2 elevates the stakes.

Unemployment Trend and Possibility of Another Rate Cut

Here’s what the latest U.S. unemployment trend looks like, and how markets reacted to the most recent report:


📈 What the Unemployment Data Shows

  • The unemployment rate in August 2025 rose to 4.3%, up from 4.2% in July.
  • Labor force participation and the employment-population ratio have stayed relatively stable month to month, though both are down somewhat over the past year.
  • Nonfarm payrolls showed weak job growth (only ~22,000 jobs added in August), and recent data revisions have cut previous job growth estimates significantly downward.
  • Long-term unemployment (those unemployed 27 weeks or more) is elevated (around 1.9 million), and makes up over 25% of all unemployed workers.

⚙️ How Markets Reacted

  • After the weak jobs/unemployment print, bond markets rallied — short-term Treasury yields dropped, as investors increasingly believe the Fed will need to ease policy.
  • Stocks had a mixed reaction: some gains in rate-sensitive sectors (like tech and growth) because a weaker labor market increases the odds of rate cuts, but also concern in more cyclical sectors over weakening demand.
  • The weak jobs report increased market expectations for future rate cuts from the Fed. Analysts & firms revised forecasts to anticipate easier monetary policy in coming Fed meetings.

🔍 What This Suggests Going Forward

The elevated unemployment rate plus weak job additions suggest that the labor market is cooling. Because the jobs picture is one of the Fed’s two mandates (the other being inflation), these trends push monetary policy toward being more accommodative. Markets are likely to expect:

  • Further rate cuts (but likely gradual, depending on inflation data)
  • Continued cautious investor behavior — sectors dependent on strong demand may be under pressure
  • Increased volatility around economic releases (jobs, inflation) as they’ll be seen as key indicators for Fed actions

Here are recent estimates showing how likely markets think further Fed rate cuts are, based on futures & other data:


📊 Cut Probabilities

Timing / MeetingImplied Probability of 25 bps CutImplied Probability of 50 bps Cut / Larger Cut
September Fed meeting~ 96% that the Fed will cut by 25 bps. (CBS News)~ 4-12%, depending on the source. (Morningstar)
October meeting~ 86% by some futures traders. (Reuters)Smaller chance; often seen as less likely for a bigger move. (Morningstar)
By end of 2025Markets are expecting multiple cuts; total cuts priced in are ~70 bps. (Reuters)But large, back-to-back cuts (50 bps each time) are seen as less likely. (Morningstar)

Here’s a summary of how market expectations (via CME FedWatch and related tools) for Fed rate moves have shifted recently — especially in light of weak jobs + inflation data:


🔍 Recent Probability Shifts

Meeting / TimeframeCurrent ProbabilitiesWhat It Was BeforeNotes on Movement
September 2025 Fed meeting≈ 95-96% chance of a 25 bps cut (Kiplinger)A week or two ago, somewhat lower (mid-80s). (Kiplinger)Increase driven by weak labor data, inflation signs, and revised payroll numbers.
Potential for 50 bps cut in Sept≈ 5-7% (~6.6%) (Kiplinger)Previously nearly zero or very low. (Kiplinger)Seen as unlikely but rising slightly — a “dovish surprise” scenario.
End of 2025 (Dec meeting)~ 75-80% chance that target rate will be ~ 3.50-3.75% (i.e. another cut or two beyond September) (Investing.com)Was lower earlier in the summer; markets have been shifting toward more cuts priced in. (Investing.com)Reflects growing consensus that loosening is likely as economic data cools.

⚙️ Interpretation

  • These shifts show markets rapidly adapting to softer economic signals — especially weak job growth and downward revisions.
  • The nearly-certain expectation of a 25 bps cut in September suggests that new data is no longer enough to shift odds away from that outcome.
  • The possibility of a larger cut (50 bps) has increased slightly, but remains low — viewed more as a potential tail-risk if conditions deteriorate further.
  • By late 2025, markets expect more easing (i.e. one or more additional cuts), though how many and how big depends heavily on inflation and jobs trajectories.
