For the first time in years, policymakers are signaling rate increases rather than cuts. Here’s what the June 2026 projections mean for markets and the economy.
What the dot plot shows
The Federal Reserve’s June 2026 Summary of Economic Projections landed with a jolt. Where the March dot plot still penciled in rate cuts for this year, the latest projections tell an entirely different story: not only are cuts off the table, but nearly half of the Fed’s voting members now see rates going higher before the year is out.
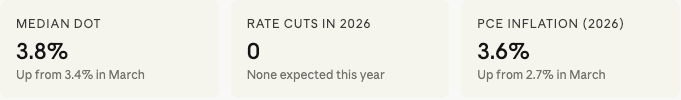
The median fed funds rate projection for year-end 2026 jumped to 3.8%, a meaningful 40-basis-point revision from March’s 3.4%. More striking than the median, however, is the distribution beneath it.
How officials voted
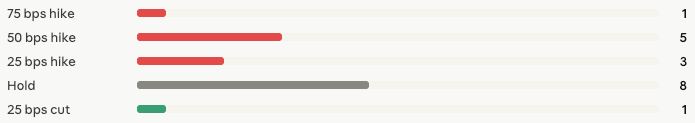
Nine of the 18 participating officials now favor at least one rate hike before the end of 2026. Six of those nine see multiple hikes as appropriate. Only one lone voice still projects a cut.
What’s driving it
The answer is inflation — specifically, an inflation picture that has deteriorated significantly since the spring. The Fed raised its 2026 PCE inflation forecast to 3.6%, up sharply from 2.7% in March. Core PCE followed suit, climbing to 3.3% from 2.7%. Officials attributed much of the move to energy-driven price pressures tied to the ongoing conflict in the Middle East.
“If this dot plot turns out to be the last, markets will have lost their clearest window into Fed thinking — just as the path becomes harder to read.”
On the growth side, the picture is more mixed. GDP projections for 2026 were trimmed modestly to 2.2% from 2.4%, while the unemployment rate outlook was little changed at 4.3%. Inflation is the dominant concern; growth and employment remain resilient enough to give hawks cover.
The Warsh wildcard
Perhaps the biggest subplot of Wednesday’s meeting was what wasn’t in the dot plot: new Fed Chair Kevin Warsh’s own projections. Warsh declined to submit a dot, citing long-held personal views about the exercise. He then raised eyebrows further by announcing a communications task force to review the Fed’s overall strategy — including, explicitly, whether the dot plot should continue to exist at all.
EY-Parthenon’s chief economist Gregory Daco flagged to Yahoo Finance that this could be the last dot plot markets ever see. If so, investors would lose one of their primary tools for gauging where rates are headed — a significant shift in how central bank policy gets communicated.
Bottom line
The rate-cut narrative that dominated early 2026 is now definitively over. The question has shifted from when will the Fed ease? to will the Fed have to tighten again? How quickly inflation data responds to the Middle East situation — and whether Chair Warsh develops his own public stance on rates — will determine which of those 18 dots proves closest to reality.
Market analysis provided by The Macro Compass is for informational purposes only. Please consult with a financial advisor before making investment decisions.
Discover more from Evergreen Financial News
Subscribe to get the latest posts sent to your email.
