Inside Today’s Tech Whipsaw

June 25, 2026 | Markets & Technology


Pre-market looked like a gift. Asian indices were ripping, Japan’s Nikkei +4.4%, South Korea’s KOSPI +5.2%, on the back of Micron’s blowout earnings after Wednesday’s close. PCE inflation data dropped at 8:30 AM and came in well-behaved enough to spark a relief rally. SPY pushed to 739.79, QQQ surged, NVDA bounced. Everything looked great going into the opening bell. It looked like this week’s tech carnage was finally over.

It wasn’t. By 9:59 AM, SPY, QQQ, and NVDA all hit their intraday lows simultaneously. What happened in between is a story about crowded positioning, a fragile macro backdrop, and a market that had been quietly cracking for weeks before today’s whipsaw made it obvious.


The Numbers

By midday, the divergence across tech was striking:

TickerChangeNote
AAPL-5.76%Worst performer in Mag 7
MSFT-3.46%Second consecutive down day
META-1.71%Ad revenue concerns resurfacing
AMZN-2.26%AWS growth narrative under pressure
GOOGL-0.87%Dow addition couldn’t hold sentiment
NVDA-1.04%Pared losses on Micron tailwind
TSLA+0.02%Effectively flat, decoupled from tech
MU+16.07%The hero of the day โ€” more below
QCOM+7.76%Beneficiary of Apple chip supply shift
INTC+0.06%Gapped 6% at open, gave it all back
AMD+2.15%Quietly holding up
ASML+4.57%Equipment names catching the MU bid
SMH+3.48%Semiconductor ETF masking single-stock pain

The VanEck Semiconductor ETF (SMH) closing up 3.48% on a day when AAPL lost nearly 6% tells you everything about how bipolar this market has become. Memory chips are thriving. Consumer tech is getting hit. The index is lying to you.


The Week That Built This Morning

Today didn’t happen in isolation. To understand the opening bell flush, you have to go back three weeks.

It started on June 5 when a stronger-than-expected May jobs report sent Treasury yields spiking and triggered a violent semiconductor selloff โ€” the Nasdaq’s worst single day since the tariff turmoil of early 2025. Then Broadcom’s earnings on June 3 added fuel: the company beat on revenue but notably declined to raise its full-year AI chip forecast, sending its stock down 14% and rattling confidence across the supply chain.

By the time this week arrived, the AI semiconductor trade was already sitting on a knife’s edge. Tuesday’s session crystallized the anxiety. A Bank of America research note flagging the possibility of up to three Federal Reserve rate hikes in 2026 hit the tape, and the market reacted like someone pulled a fire alarm in a crowded theater. The Nasdaq fell 2.21%. South Korea’s KOSPI plunged nearly 10% โ€” its steepest decline in months โ€” as Samsung and SK Hynix collapsed on fears that the AI memory rally had run too hot, too fast.

The Fed’s own dot plot, released at last week’s June meeting, had already removed the projected 2026 rate cut. Nine of eighteen policymakers were now penciling in a hike. PCE inflation was tracking at 3.3โ€“3.6% โ€” well above the Fed’s 2% target.

That was the backdrop walking into this morning.


The Micron Factor: A Tale of Two Tapes

Micron’s Q3 2026 results, reported after Wednesday’s close, were genuinely historic. Revenue of $41.46 billion โ€” up from $23.86 billion the prior quarter and a staggering $9.30 billion in the year-ago period. EPS of $25.11, blowing past the $20.20 consensus estimate by more than 24%. Cloud Memory gross margins hit 83%. The company’s HBM (High Bandwidth Memory) product line, the backbone of AI accelerator systems, is sold out through the end of the year.

This was the catalyst that sent Asia ripping overnight and made the pre-market look so promising. Memory chip names โ€” ASML, QCOM, AMD โ€” all opened strong. SMH gapped up. The narrative was simple: Micron proved the AI infrastructure buildout is real, accelerating, and enormously profitable.

But here’s the problem. The market had already priced in a monster quarter. MU shares had run to an all-time high earlier this week before pulling back 13% ahead of the print. When results came in and the stock surged 16%, it was recovering losses โ€” not making new ground. And crucially, the Micron tailwind was specific to the memory supply chain. It did nothing to address the macro overhang that has been quietly suffocating consumer-facing tech names.

AAPL down nearly 6% today is not a Micron story. It’s a rate story, a valuation story, and a rotation story โ€” all at once.


Apple: The Day’s Defining Move

AAPL’s nearly 6% decline deserves its own paragraph because it’s the clearest signal of what’s actually happening beneath the surface.

The stock opened at $287, already down from Wednesday’s close of $293. It never recovered. By midday it was trading at $276 โ€” a level last seen in early June. Over the past month, AAPL has fallen from $315 to $276, a drawdown of more than 12% with no single obvious catalyst. That’s not a headline event. That’s systematic selling by large holders rotating out of a name that had become the ultimate “safe tech” parking spot in an era of elevated rates.

At current interest rates and with the Fed now openly discussing hikes, the premium investors were willing to pay for AAPL’s predictability and buyback program has compressed. When you can get 4.5% in Treasuries with zero credit risk, paying 30x earnings for a company with slowing iPhone growth requires a level of conviction that is evaporating.

Meanwhile, QCOM surged 7.76% today โ€” directly benefiting from recent reports that Apple is diversifying its chip supply chain, a move that benefits Qualcomm at AAPL’s expense. The rotation within the sector is surgical.


The Gap-and-Trap: What Really Happened at 9:30 AM

The synchronized low across SPY, QQQ, and NVDA at exactly 9:59 AM was not a coincidence. It was the conclusion of a coordinated distribution sequence that played out in the first twenty-nine minutes of trading.

Pre-market optimism โ€” built on the Micron beat and the Asian market surge โ€” created a window of artificial demand at the open. Retail and momentum traders, seeing the green futures and the PCE relief, bought aggressively. SPY pushed to 739.79, within striking distance of the prior session high at 739.95. QQQ surged. The tape looked bullish.

What the tape didn’t show was the institutional selling happening into that demand. Large players who had been positioned bearishly all week โ€” some visibly, through deep in-the-money put positions in the tens of millions of dollars โ€” used the open rip as a distribution opportunity. Once that buying was absorbed, the bids evaporated simultaneously across all three instruments, producing the synchronized 9:59 AM flush that took SPY from 739 to 729.60 โ€” a move of more than nine dollars in less than thirty minutes.

The $730 strike on SPY put options, which carried over 10,000 contracts of open interest entering today, caught the low almost to the dollar. That is not coincidental. It is GEX structure โ€” gamma exposure from dealer hedging โ€” functioning exactly as it should.


The Macro Ceiling That Won’t Move

Underlying all of today’s price action is a simple and stubborn reality: the Federal Reserve has effectively told the market that the rate cutting cycle is over, and a hiking cycle may be beginning.

PCE inflation, the Fed’s preferred measure, is now projected to hit 3.6% in 2026 with core at 3.3%. The median policymaker expects tightening by year-end. Markets are now pricing a coin-flip probability of a rate hike by October and nearly 67% odds of one by December.

In this environment, the math on high-multiple technology stocks is straightforward and unflattering. Higher rates mean higher discount rates. Higher discount rates mean future earnings are worth less today. The stocks that ran hardest on the AI narrative โ€” the ones trading at 50x, 80x, even 100x forward earnings โ€” face the steepest revaluation.

The dichotomy playing out in real-time today illustrates this perfectly. Memory chips (MU, QCOM, AMD) have near-term, tangible, rapidly growing earnings from AI infrastructure spending. They are somewhat insulated from rate-driven multiple compression because their growth is so explosive that valuation math almost doesn’t apply in the conventional sense. Consumer tech (AAPL, MSFT, GOOGL, META, AMZN) carries premium valuations built on predictable but moderate growth โ€” exactly the profile that suffers most when rates rise.


What the Institutional Put Flow Is Saying

What the Institutional Put Flow Is Saying

Perhaps the most telling signal of the day came from the options market, where Unusual Whales flagged a cascade of notable bearish prints in SPY that paint a clear picture of institutional positioning.

The headline trades:

  • SPY $740P 7/17/26 โ€” $32.7M, 25,000 contracts, hit on the ask. A deep ITM put expiring in 22 days with near-delta-1 exposure. This is not a speculative play โ€” it is the economic equivalent of a $32.7M short stock position with defined risk and no borrow cost.
  • SPY $750P 8/21/26 โ€” $58.6M, floor-style print. Deeper ITM, longer dated. Classic portfolio hedge structure โ€” someone protecting a large long book against meaningful downside over the next two months.
  • SPY $725P 9/18/26 โ€” $768K, ask-side. Further OTM, 85 days out. Smaller in notional but the September expiration is notable โ€” this is tail risk protection, not a near-term directional bet.

Combined, those three prints represent over $92 million in bearish SPY exposure layered across three separate expiration windows: July, August, and September.

Alongside the big prints, Unusual Whales flagged repeated hits in same-day and next-day contracts clustered around the 733, 735, 736, and 737 strikes โ€” the exact levels that acted as resistance all morning after the opening flush. That kind of repeated hitting at specific strikes is consistent with dealers and active traders pressing known resistance rather than adding new directional exposure.

One counterpoint worth noting: there were repeated hits on the SPY $735C 6/26/26 โ€” tomorrow’s expiration โ€” but the flow was predominantly bid-side premium. Bid-side call flow is the opposite of bullish conviction; it suggests sellers are writing calls into the bounce, not buyers chasing upside. The call flow, in other words, reinforces the bearish read rather than complicating it.

Deep ITM puts with near-delta-1 exposure are not lotto plays. They are used by institutions to hedge large long equity portfolios without the cost and complexity of borrowing shares. The choice to layer across July, August, and September expirations is deliberate โ€” this is not a one-event hedge. Someone with serious capital is building a structured bearish position that survives multiple catalysts: the next FOMC meeting, Q2 earnings season, and any further PCE or labor market data.

The timing โ€” placed into a PCE-driven relief rally on a day when SPY briefly touched 739 โ€” makes the conviction clear. These are not panic trades placed at the low. They are distribution trades placed into strength.


The Divergence That Defines This Market

Zoom out and the picture snaps into focus. The AI infrastructure buildout is real โ€” Micron’s $41 billion quarter proves it beyond any reasonable doubt. The companies supplying the picks and shovels of that buildout (memory, equipment, networking) are printing record results and will likely continue to do so.

But the companies selling software, services, subscriptions, and consumer devices into an economy where the Fed may be about to raise rates are facing a very different calculus. The assumption that powered the 2024โ€“2025 tech rally โ€” that rate cuts were coming and growth would be rewarded โ€” has been invalidated. The new assumption, increasingly priced into the options market and into institutional positioning, is that rates stay higher for longer and that the valuation premium for big tech needs to compress.

Today’s session was a preview of what that compression looks like in real time: AAPL -6%, MSFT -3.5%, META -1.7%, the broad tape red โ€” while the semiconductor supply chain quietly moved higher on the back of the most profitable memory chip quarter in history.

The AI trade is not over. But the everything-tech rally almost certainly is.


Market analysis provided by The Macro Compass is for informational purposes only. Please consult with a financial advisor before making investment decisions.
Troops on the Move: What Wall Street Expects for the Week Ahead

The geopolitical temperature in the Middle East just hit a boiling point, and investors are bracing for the impact. As the U.S. prepares to deploy up to 10,000 additional ground troops to the region, the market’s “wait and see” approach is rapidly shifting into aย “risk-off” sprint.

If youโ€™re watching your portfolio this weekend, here is the breakdown of how the market is expected to react when the opening bell rings on Monday, March 30, 2026.

The Oil Factor: $200 a Barrel?

Energy is the primary engine of this volatility. With “Operation Epic Fury” entering its second month, Brent crude has already climbed past $112. However, analysts at Macquarie Group warn that if the conflict escalates furtherโ€”specifically involving the closure of the Strait of Hormuzโ€”we could see a historic spike toward $200 per barrel. This isn’t just a gas pump problem; itโ€™s a massive inflationary headwind that could force the Federal Reserve to keep interest rates high.

Equity Markets: The Correction Search

The S&P 500 has already shed over 4% in March, and the bleeding might not be over. Many strategists suggest that a formal ground invasion could trigger a broader 8% to 10% correction.

  • The Losers:ย Tech giants and growth stocks (the “Magnificent Seven”) are feeling the heat as rising Treasury yields make their future earnings less attractive.
  • The Winners:ย Energy (XLE) and Defense sectors continue to outperform the broader market as military spending and oil prices surge.

The Flight to Safety

When the drums of war beat louder, investors hide in the classics. Expect the U.S. Dollar and Gold to see continued strength next week. Gold, in particular, remains the ultimate hedge against the “Stagflation” fearsโ€”rising prices coupled with slowing growthโ€”that are currently haunting global markets.

The “Peace Deal” Wildcard

The biggest variable remains the rhetoric from the White House. While troop movements signal escalation, President Trump has maintained that this buildup is a negotiating tactic to force a peace deal with Iran. He has predicted the economy will “take off like a rocket ship” once a resolution is reached. Whether the market believes that “leverage” story or prepares for a prolonged conflict will dictate the swing of every trading session next week.

The Bottom Line: Expect a bumpy ride. High-tempo combat operations are projected to last at least another two to four weeks, meaning volatility is the new “normal” for the foreseeable future.

โ€œU.S. โ€˜Insolventโ€™? What the Treasury Numbers Really Mean for the Marketsโ€

The Headlines Are Alarmingโ€”but Donโ€™t Panic

Recently, a flurry of media coverage claimed that the U.S. government is โ€œinsolvent.โ€ At first glance, this sounds like a red alert for investorsโ€”but the reality is more nuanced. The Treasuryโ€™s latest report does show that long-term obligations exceed assets. This includes future commitments like Social Security, Medicare, and federal pensions. On paper, that looks like insolvencyโ€”but itโ€™s very different from running out of cash or defaulting on debt tomorrow.


Why the U.S. Isnโ€™t Going Broke

Unlike a private company, the U.S. government has tools that keep it solvent in practice:

  • It can raise taxes
  • It can borrow in its own currency
  • It can coordinate with the Federal Reserve to manage liquidity

This is why U.S. Treasuries remain the worldโ€™s โ€œrisk-freeโ€ benchmark, even as debt grows. The so-called insolvency is really a long-term fiscal warning, not an immediate financial crisis.


What This Means for Markets

While the headline is unlikely to trigger a sudden market collapse, there are some important implications:

  1. Rising Yields Over Time โ€“ Bigger deficits mean more Treasury issuance, which can push interest rates higher. Higher yields generally pressure stock valuations, especially growth-heavy sectors.
  2. Interest Rate Pressure โ€“ Persistent deficits could keep yields structurally higher, either through more borrowing or inflationary pressure if the Fed monetizes debt.
  3. Dollar and Global Demand Risk โ€“ If foreign investors slow Treasury purchases, it could weaken the dollar and push yields even higherโ€”but this is a long-term theme, not a day-to-day driver.
  4. Political Tail Risks โ€“ Debt ceiling standoffs or delayed payments can spark market volatility. The risk is not accounting insolvency but policy dysfunction, which has triggered short-term spikes in the past.

The Bottom Line

The takeaway for investors:

  • The U.S. โ€œinsolvencyโ€ story is an accounting technicality, not an imminent market disaster.
  • Its real impact is gradual, influencing interest rates, valuations, and the macro backdrop over the coming years.

In short: donโ€™t panic at the headlinesโ€”but keep an eye on the long-term pressures shaping rates and market valuations.

    Market Watch: Iranโ€™s Leadership Shift and Ongoing Conflict Stir Volatility

    Recent developments in the Middle East are keeping global markets on edge. Iran has appointed Mojtaba Khamenei, the son of the late Supreme Leader Ali Khamenei, as its new Supreme Leader, while military tensions in the region continue. These twin eventsโ€”leadership succession and ongoing conflictโ€”are injecting heightened uncertainty into financial markets worldwide.

    A Hardline Leader in a Volatile Time

    Mojtaba Khameneiโ€™s rise is controversial. While state media highlight strong support, domestic sentiment appears deeply divided. Many observers caution that the new leadership is inexperienced and unlikely to pursue compromise, signaling that the current regional instability may persist. International reactions have been critical, adding layers of geopolitical tension.

    How Markets Are Reacting

    Markets generally dislike uncertainty, and geopolitical conflicts are no exception. The combination of ongoing military action and a potentially hardline Iranian leadership is creating a risk-off environment. Investors are moving cautiously, seeking safe havens such as bonds, gold, and other traditionally lower-risk assets.

    Energy and defense sectors are seeing relative interest as investors anticipate potential disruptions in the Middle East. At the same time, volatility indices are elevated, reflecting broader concerns about global economic stability.

    Key Factors to Watch

    • Conflict Escalation: Any expansion of the war or involvement of additional countries could heighten market stress.
    • Energy Prices: Spikes in oil or gas prices can feed inflation and slow growth, affecting investor sentiment.
    • Supply Chain Stability: Disruptions in global trade due to conflict can ripple through multiple industries.
    • Investor Psychology: Markets often price in worst-case scenarios early; sentiment can swing quickly if news suggests de-escalation.

    Bottom Line

    While markets may experience bouts of volatility in the near term, much depends on how the conflict evolves and whether diplomatic solutions emerge. Investors are watching closely, balancing risk against broader economic fundamentals. In times like these, uncertainty reignsโ€”but so too does opportunity for those keeping a careful eye on global developments.


    How Geopolitical News Moves Financial Markets: Lessons from the Iran War Headlines

    Financial markets often react instantly to geopolitical developments. When conflicts escalateโ€”or when there are signals that tensions may easeโ€”investors rapidly reassess risk, energy supply, and economic outlook.

    A clear example occurred today after comments from Donald Trump suggesting the war involving Iran could be nearing its conclusion. The remarks triggered sharp movements across stocks, oil markets, and other assets, illustrating how sensitive global markets are to geopolitical news.

    A Sudden Market Reversal

    Earlier in the day, markets were under pressure due to rising energy prices and fears of prolonged conflict. Oil had surged above $100 per barrel amid concerns that fighting in the region could disrupt supplies moving through key shipping routes.

    However, sentiment shifted dramatically after Trump indicated that the conflict was โ€œvery far ahead of scheduleโ€ and could soon be completed. Investors quickly interpreted the comments as a sign that the war might end sooner than expected. (uk.finance.yahoo.com)

    As a result:

    • Major U.S. stock indexes reversed earlier losses and moved higher.
    • Oil prices fell sharply after earlier spikes.
    • Risk appetite returned across financial markets.

    The late-day rally highlighted how quickly markets can change direction when new information alters investorsโ€™ expectations.

    Why War and Peace Affect Markets

    Geopolitical conflicts influence markets through several key channels.

    Energy Supply and Oil Prices

    The Middle East plays a critical role in global energy supply. Much of the worldโ€™s oil flows through the Strait of Hormuz, a narrow but vital shipping route. When tensions rise in the region, investors fear that oil shipments could be disrupted.

    Those fears drove oil prices sharply higher earlier during the Iran conflict. When the possibility of de-escalation emerged, crude prices quickly dropped as the perceived supply risk eased. (Forbes)

    Lower energy prices can also support the broader economy by reducing inflation pressures and lowering costs for businesses and consumers.

    Investor Risk Sentiment

    Wars tend to push investors toward safer assets such as commodities, government bonds, and defensive sectors. The possibility of peace, on the other hand, often encourages investors to move capital back into equities and growth-oriented investments.

    That shift in sentiment was visible in the rapid rebound of the S&P 500 and exchange-traded funds such as the SPDR S&P 500 ETF Trust following Trumpโ€™s remarks.

    Late-Day Volatility

    Large moves related to news often occur late in the trading session. Several factors can amplify these reactions:

    • Short sellers closing positions after sudden positive news
    • Institutional investors adjusting portfolios before the market close
    • Options-related hedging activity that accelerates price movements

    These forces can create rapid spikes or reversals during the final hour of trading.

    The Bigger Picture

    Markets are forward-looking. Investors constantly evaluate how new information could change the trajectory of economic growth, energy prices, and geopolitical stability.

    While a statement suggesting the end of a war can spark an immediate rally, markets ultimately respond to confirmed developments rather than speculation alone. Investors will continue watching for official ceasefire agreements, stability in energy markets, and long-term geopolitical outcomes.

    The events surrounding todayโ€™s announcement provide a powerful reminder: in modern markets, geopolitical headlines can move billions of dollars in secondsโ€”and understanding the economic mechanisms behind those moves helps investors make sense of sudden volatility.

    Potential Market Reaction to Possible US-Iran War

    Hereโ€™s a data-grounded picture of how financial markets have been responding โ€” and are likely to respond โ€” to the risk of a U.S.โ€“Iran war or major escalation, based on recent price action and historical patterns: (FinancialContent)


    ๐Ÿ“ˆ 1) Energy Markets โ€” Immediate & Most Sensitive Reaction

    Crude Oil Prices Surge

    • Oil benchmarks like Brent and WTI have climbed to multi-month highs as traders price in the possibility of supply disruptions, especially via the Strait of Hormuz. (The National)
    • Analysts warn that if conflict escalates materially โ€” e.g., a blockade or bombing of energy infrastructure โ€” oil could jump $10โ€“$15+ per barrel in a short period. (Khaleej Times)

    Why this matters:
    โ€ข Higher oil โ†’ higher energy sector profits.
    โ€ข Higher oil โ†’ higher gasoline/fuel costs worldwide โ†’ inflation pressures โ†’ harder conditions for growth-oriented stocks.

    Energy Stocks Often Outperform

    Energy producers (especially large integrated oil companies) have seen share gains as crude prices rally, since higher prices typically boost their margins. (FinancialContent)


    ๐Ÿ“‰ 2) Equities โ€” Volatility & Mixed Sector Response

    Broad Indices Face Pressure

    When geopolitical risk spikes:

    • Investors tend to sell equities or rotate out of risk assets. Recent mid-week U.S. markets softened as oil climbed on Iran tension fears. (Yahoo Finance)
    • Historically, major geopolitical escalations can cause short-term pullbacks in the S&P 500, Dow, and Nasdaq as traders reassess growth expectations and risk sentiment. (Markets)

    Sector Rotation

    If conflict risk grows into actual military engagement:

    • Energy and defense stocks tend to outperform or hold up better.
    • Travel / Airlines / Transportation stocks typically underperform due to higher fuel costs and weaker consumer confidence. (FinancialContent)

    ๐Ÿ›ก๏ธ 3) Safe-Haven Assets โ€” Flows to Gold & Bonds

    Although not all current headlines show this yet, history and market theory suggest:

    • Gold and precious metals often rally on geopolitical risk as investors seek safety. (Markets)
    • Government bonds can also rally (yields fall) during equity sell-offs and risk-off sentiment. (Markets)

    ๐Ÿ’น 4) Currencies & Volatility

    • The U.S. dollar often strengthens as a safety play when markets fear global instability. (Allianz Global Investors)
    • Stock market volatility indicators (like the VIX) typically rise on escalating geopolitical risk, reflecting unease and trading swings. (FinancialContent)

    ๐Ÿง  Why Markets React This Way

    The primary economic channel is energy supply disruption risk:

    • Iran and neighboring Gulf states are central to global oil export flows. A confrontation threatens that supply, driving up energy prices quickly. (Khaleej Times)
    • Higher energy prices feed into broader inflation, which can squeeze corporate profits and consumer spending.
    • Conflict risk amplifies uncertainty, prompting investors to rebalance portfolios toward safer or hedge-oriented assets.

    ๐Ÿ•ฐ๏ธ Typical Market Behavior Timeline

    Hereโ€™s how markets usually trend around rising war risk:

    1. Threat Stage:
      โ€ข Oil rises; equities drift lower or flatten.
      โ€ข Safe havens begin to attract flows. (The National)
    2. Escalation Stage (actual strikes/hostilities):
      โ€ข Sharp spikes in oil.
      โ€ข Broad equity indices fall more noticeably.
      โ€ข Gold & government bonds strengthen.
      (This pattern was seen in past Iran-related episodes.) (Markets)
    3. Resolution or De-escalation:
      โ€ข Risk assets can rebound if conflict shortens or is contained.
      โ€ข Energy prices can ease if alarms fade.

    ๐Ÿ“Š Bottom Line

    Near-term:

    • Oil & energy stocks up, equities more mixed/soft.
    • Risk assets tend to wobble; volatility up.
    • Safe havens (gold, bonds, sometimes the USD) often strengthen.

    If conflict actually breaks out:

    • Expect higher oil prices, greater volatility, and a broader risk-off shift in markets.

    Implications if EU Liquidates US Treasuries

    With Trump pushing the U.S. to acquire Greenland, this could seriously damages trans-Atlantic relations. If the EU responds by liquidating (or even signaling liquidation of) U.S. Treasuries, hereโ€™s what that would actually imply โ€” economically, financially, and strategically.


    ๐Ÿงญ First, context check (important)

    Greenland is tied to Denmark (EU/NATO).
    So this isnโ€™t just a bilateral spat โ€” itโ€™s interpreted as:

    • U.S. pressure on European sovereignty
    • A test of alliance trust
    • A reminder that Treasuries can be political leverage

    That framing is what markets would react to.


    ๐Ÿงจ Immediate market implications (if EU action is credible)

    ๐Ÿ“‰ 1. U.S. Treasuries: yields spike

    • EU institutions are large, price-insensitive holders
    • Even threats of liquidation would:
      • Push 10Yโ€“30Y yields higher
      • Steepen the yield curve
    • Auction demand weakens โ†’ higher term premium

    ๐Ÿ“Œ Translation:
    Higher borrowing costs for:

    • Mortgages
    • Corporations
    • U.S. deficits (this is the big one)

    ๐Ÿ’ฑ 2. USD: short-term up, medium-term down

    Short-term:

    • Risk shock โ†’ USD reflexively rises

    Medium-term:

    • Reserve diversification narrative accelerates
    • EUR, CHF, gold benefit
    • USD loses โ€œunquestioned reserveโ€ premium

    ๐Ÿ“Œ Markets would read this as:

    โ€œTreasuries are no longer politically neutral.โ€

    Thatโ€™s huge.


    ๐Ÿ“‰ 3. U.S. equities: bearish, volatility spikes

    • Rising yields = valuation compression
    • Tech & growth hit hardest
    • Financials donโ€™t necessarily benefit โ€” disorderly yield moves hurt balance sheets

    VIX goes up. Liquidity thins.


    ๐Ÿช™ Safe havens & alternatives

    ๐Ÿฅ‡ Gold: strongly bullish

    This is goldโ€™s dream setup:

    • Geopolitical fracture
    • Weaponization of finance
    • Questioning sovereign debt safety
    • Reserve rebalancing by central banks

    Gold wouldnโ€™t just rise โ€” it would reprice structurally higher.


    ๐Ÿฅˆ Silver

    • Short-term: volatile (risk-off)
    • Medium-term: follows gold higher
    • Gold/Silver ratio initially spikes, then compresses

    ๐ŸŒ Systemic / strategic implications (this is the real story)

    โš ๏ธ 4. Alliance fracture premium

    Markets would start pricing:

    • Political risk inside NATO
    • Less coordination on sanctions, defense, trade
    • Higher long-term uncertainty premiums

    This is not priced into markets today.


    ๐Ÿฆ 5. Fed backstop becomes unavoidable

    If EU selling is material:

    • The Fed would implicitly have to absorb supply
    • Balance sheet credibility comes into question
    • Fiscal dominance fears rise

    ๐Ÿ“Œ Thatโ€™s inflationary over time, even if growth slows.


    ๐ŸŒ 6. Accelerated financial bloc formation

    This would push:

    • EU โ†’ greater euro-centric reserve strategy
    • More bilateral trade settlement outside USD
    • Faster movement toward regional financial systems

    Not the end of dollar dominance โ€” but the beginning of erosion, which markets hate.


    ๐Ÿ“Š Asset impact summary

    AssetImpact
    Treasuriesโ†“ Prices, โ†‘ Yields
    USDShort โ†‘ / Medium โ†“
    U.S. equitiesโ†“ (growth worst)
    EU assetsRelative โ†‘
    Goldโ†‘โ†‘โ†‘
    SilverVolatile โ†’ โ†‘
    VIXโ†‘
    Credit spreadsWiden

    ๐Ÿง  What markets would really focus on

    Not Greenland itself โ€” but:

    • Is this symbolic or strategic?
    • Is the EU acting coordinated?
    • Do others (Japan, Gulf states) quietly follow?
    • Does the U.S. respond financially or politically?

    If answers trend the wrong way โ†’ systemic repricing.


    ๐Ÿ”‘ Bottom line

    If Greenland rhetoric escalates into EU Treasury liquidation:

    • This is not a normal geopolitical headline
    • It challenges the assumption that U.S. debt is untouchable
    • Gold becomes the clearest winner
    • U.S. financial conditions tighten fast
    • Markets price a more fragmented world

    It wouldnโ€™t cause a crash overnight โ€”
    but it would permanently raise the risk premium on U.S. assets.

    How Will the Market Respond to the US Military Action in Venezuela

    Here are some possible reactions in the financial markets and the economy:

    ๐Ÿ”ฅ 1. Oil markets โ€” the biggest immediate effect

    • Venezuela sits on the worldโ€™s largest proven oil reserves, so any conflict automatically draws energy market attention. (Reuters)
    • Short-term uncertainty tends to push oil prices up, because traders price in possible future supply disruptions. (FinTech News UK)
    • Some analysts say prices may stay relatively stable in the very short run due to current oversupply and lack of infrastructure damage, but itโ€™s a fluid picture. (Business Insider)
    • If exports drop because of war, it tightens heavy crude supplies, which can raise gasoline and diesel costs globally. (GovFacts)

    Market behavior summary
    โš ๏ธ Risk-off sentiment โ†’ bullish for oil
    ๐Ÿ›ข๏ธ If infrastructure is hit โ†’ significant oil price spikes possible
    ๐Ÿ“‰ If markets see stabilizing news โ†’ prices could pull back


    ๐Ÿ“‰ 2. Equity markets & investor sentiment

    • Global stock markets typically react to geopolitical conflict with short-term volatility โ€” equities may dip initially as risk aversion rises. (FinTech News UK)
    • Emerging market stocks often sell off first, while โ€œsafe havensโ€ like U.S. Treasuries, gold, and certain currencies (JPY, USD) see inflows. (FinTech News UK)
    • Defense and energy stocks are often perceived as beneficiaries during geopolitical risk events (though this is speculative and not guaranteed). (See Reddit sentiment on this) (Reddit)

    ๐Ÿช™ 3. Commodities beyond oil

    • Gold and silver often rally in geopolitical stress due to safe-haven demand, though short-term swings can be unpredictable. (The Economic Times)
    • Metals like copper may also see pressure if global manufacturing growth slows due to increased energy costs and uncertainty. (The Economic Times)

    ๐Ÿ“Š 4. Broader market and economic implications

    Inflation & consumer prices
    ๐Ÿ‘‰ Rising oil and energy costs can feed into higher transport and consumer prices, adding inflationary pressure globally. (The Financial Analyst)

    Supply chain & logistics
    ๐Ÿ‘‰ Conflict in Venezuela can raise shipping insurance costs and disrupt regional trade routes, increasing costs for companies that rely on Latin American supply chains. (Discovery Alert)

    Regional impact
    ๐Ÿ‘‰ Neighboring countries may see capital flight and currency stress as investors pull back from Latin America due to perceived risk. (FinTech News UK)


    ๐Ÿ“Š 5. Longer-term outlook

    The long-term market impact depends heavily on what happens next:

    If a stable government emerges and sanctions ease:
    โœ”๏ธ Oil production and exports could eventually increase โ†’ long-term oil supply boost and investment returns. (Allianz Global Investors)

    If conflict drags on:
    โš ๏ธ Continued volatility, higher risk premiums, sustained inflation pressure, and slower global growth. (FinTech News UK)


    ๐Ÿ“‰ Quick summary for investors

    MarketLikely Reaction
    Oil pricesUp or volatile
    Stock marketsShort-term drop / volatility
    Safe haven assets (Gold/Treasuries)Up
    Emerging marketsRisk-off selling
    Defense & energy equitiesPotential interest (speculative)

    Recession Worries and Effect on Market

    Recession worries are one of the biggest drivers of market sentiment right now โ€” even more than inflation or rates โ€” because they affect earnings, consumer demand, and Fed policy expectations. Letโ€™s break it down clearly:


    โš ๏ธ Why Recession Worries Are Rising

    Several recent data points are fueling renewed concern:

    • Job revisions: BLS downward revision of ~911,000 jobs suggests the labor market was weaker than reported.
    • Consumer spending: Slowing in discretionary areas (travel, retail, autos) indicates households are tightening budgets.
    • Manufacturing and housing: Both showing contraction or stagnation โ€” leading indicators of growth.
    • Yield curve inversion: Still one of the most reliable predictors of recession (2-year > 10-year).
    • Corporate commentary: Q3 earnings calls show more cautious outlooks, especially in cyclicals and tech hardware.

    ๐Ÿ“‰ How Markets React to Recession Fears

    Market SegmentTypical ReactionExplanation
    Equities๐Ÿ”ป Volatile or downInvestors anticipate lower corporate earnings; shift toward defensive sectors (utilities, healthcare, staples).
    Bonds๐Ÿ”ผ Prices up (yields down)Investors seek safety in Treasuries; flight to quality drives yields lower.
    Commodities๐Ÿ”ป MixedOil and industrial metals fall on weaker demand expectations; gold may rise as a safe haven.
    U.S. Dollarโš–๏ธ MixedOften strengthens short-term as investors move into USD assets, but can weaken later if Fed cuts aggressively.
    Tech & Growth Stocks๐Ÿ”ป Near-term hit, later reboundHigher rates + slower growth = weaker valuations, but rate cuts can later lift long-duration growth names.

    ๐Ÿงฉ Key Dynamic โ€” โ€œBad News Is Good Newsโ€

    In a slowing economy, markets often react paradoxically:

    • Weak data โ†’ Markets expect Fed rate cuts โ†’ Stocks and bonds may rise temporarily.
    • But if data turns too weak โ†’ Earnings fall sharply โ†’ Equities eventually correct.

    So the balance between slowdown and policy support determines direction.


    ๐Ÿ”ฎ Outlook (as of now)

    Hereโ€™s the marketโ€™s base case:

    ScenarioProbabilityMarket Implication
    Soft landing (no recession)~55%Stocks stabilize; Fed cuts slowly; moderate growth continues.
    Mild recession (2025 Q1โ€“Q2)~35%Equities correct 5โ€“10%; bonds rally; Fed cuts more aggressively.
    Deep recession~10%Broad risk-off; defensive sectors outperform; unemployment spikes.

    ๐Ÿ“Š What Investors Are Watching

    1. Next jobs and CPI reports โ€” confirm if slowdown + inflation easing = room for cuts.
    2. Corporate earnings guidance (Q4) โ€” how companies see 2026 demand.
    3. Fed communications โ€” tone shift toward risk management or โ€œinsurance cuts.โ€
    4. Credit spreads & defaults โ€” early signs of financial stress.

    ๐Ÿงญ Summary

    Recession worries:

    • Increase market volatility.
    • Shift capital toward safe assets (bonds, gold, cash).
    • Lead investors to price in more Fed cuts.
    • Usually pressure equities until the policy response turns clear.

    Market Recap Since Last Post

    It’s been a couple of week since my last post. Here is a quick summary of the market.


    ๐Ÿ“‰ Early Week:

    Markets opened softโ€”investors cautious about rates, earnings, and the economy.

    ๐Ÿ“ˆ Late Week Recovery:

    Dip buyers stepped in as treasury yields cooled and no major negative shocks hit.

    ๐Ÿงญ Index Snapshot:

    IndexWeekly ToneNotes
    S&P 500 (SPY)Mixed โ†’ Modestly HigherRebounded off lows
    Nasdaq (QQQ)ChoppyTech strong early, faded midweek
    DowFlatIndustrials and banks lagged

    Investor mood: Cautious optimism, but no conviction breakout.


    ๐Ÿฆ FED & ECON POLICY

    โœ… Rate Hike Pause Likely

    • Fed speakers hinted they may hold rates steady, but aren’t signaling cuts yet.
    • This eased pressure on equities late in the week.

    ๐Ÿ“‰ Yields Pull Back Slightly

    • 10-Year Treasury backed off highs โ†’ helped growth/tech stocks.
    • Bond market volatility still keeping big funds cautious.

    ๐Ÿงพ Inflation Data

    • No major surprises.
    • Some signs of cooling, but Fed wants more proof.

    ๐Ÿšจ POLITICAL FACTORS / GOVERNMENT RISK

    โš ๏ธ Government Shutdown Threat Re-Emerging

    • Lawmakers are again under pressure to pass a funding bill.
    • If negotiations fail, even a short shutdown could rattle markets, especially:
      • Defense contractors
      • Federal contractors
      • Consumer confidence

    No panic yetโ€”but traders are watching headlines.

    ๐ŸŸ  Election Cycle Ramps Up

    • Political posturing around spending & taxes is increasing volatility risk.
    • Markets dislike uncertainty โ†’ this could show up more next week.

    ๐ŸŒ Geopolitical Situations

    • Ongoing international tensions (e.g., Middle East, Ukraine, tariffs talk) havenโ€™t disrupted markets yet.
    • Oil prices cooled off โ†’ helpful for inflation expectations.

    ๐Ÿ›๏ธ REGULATORY / POLICY IMPACT

    • Tech & AI regulation talk resurfaced in Congress โ€” hasnโ€™t hit valuations yet.
    • China trade policy and tariffs are still headline-sensitive, especially for:
      • AAPL
      • TSLA
      • Semis (NVDA, AMD)

    ๐Ÿ“Š EARNINGS & MARKET DRIVERS

    • Mixed reactions in corporate earnings calls โ€” no blowups, no euphoria.
    • Forward guidance is soft but acceptable.
    • Options flow favors SPY, NVDA, and AAPL calls into next week.

    โœ… BIG PICTURE TAKE

    • No meltdown, no breakout โ€” just controlled chop.
    • Fed + politics + earnings = next week setup.
    • Shutdown talk could quickly flip sentiment if negotiations stall.
    • Traders are positioning for short bursts, not long swings.

    Here are the sectors most likely to be affected by a potential government shutdown, plus those that would likely stay resilient or benefit:


    ๐Ÿšจ Most at Risk if a Shutdown Hits

    ๐Ÿ›๏ธ 1. Government Contractors / Defense

    Companies relying on federal contracts could see delayed payments or halted projects.

    Examples:

    • Lockheed Martin (LMT)
    • Raytheon (RTX)
    • Northrop Grumman (NOC)
    • General Dynamics (GD)

    ๐Ÿข 2. Industrials & Infrastructure

    Shutdowns stall planning, permits, energy projects, and public works.

    Examples:

    • Caterpillar (CAT)
    • United Rentals (URI)
    • AECOM (ACM)
    • Construction suppliers

    ๐Ÿ“‰ 3. Financials

    Markets may see volatility, and lending activity slows if economic uncertainty pops.

    Examples:

    • JPM, BAC, MS, GS
    • Regional banks

    ๐Ÿ‘” 4. Travel & Airlines

    Government worker furloughs + reduced airport staff can disrupt flights & demand.

    Examples:

    • Delta (DAL)
    • United (UAL)
    • Southwest (LUV)

    ๐Ÿ›๏ธ 5. Consumer Discretionary

    A shutdown impacts spending confidence and government-backed consumer programs.

    Examples:

    • Amazon (AMZN)
    • Home Depot (HD)
    • Nike (NKE)

    ๐ŸŸก Neutral or Mixed Impact

    ๐Ÿ  Real Estate

    • Higher volatility, but shutdowns donโ€™t immediately change REIT performance.
    • Housing-related names might dip if mortgage processing slows.

    โœ… Sectors That Usually Hold Up or Benefit

    ๐ŸŒก๏ธ 1. Healthcare & Pharma

    Medicare/Medicaid arenโ€™t halted, and the sector is defensive.

    Examples:

    • UNH, JNJ, PFE, MRK

    โšก 2. Utilities

    Low-beta, defensive, and not dependent on government funding.

    Examples:

    • DUK, SO, NEE

    ๐Ÿ“ฑ 3. Mega-Cap Tech / AI

    These are less tied to federal funding and still attract inflows when volatility hits.

    Examples:

    • AAPL, MSFT, NVDA, GOOG, META

    ๐Ÿฅซ 4. Consumer Staples

    People still buy essentials regardless.

    Examples:

    • Costco (COST)
    • Walmart (WMT)
    • Procter & Gamble (PG)

    ๐Ÿช™ 5. Gold / Treasuries (Safe Havens)

    If shutdown fear rattles markets, money rotates defensively.

    Examples:

    • GLD (gold ETF)
    • TLT (treasuries ETF)

    Q2 GDP Growth Rate Revised up to a 3.8% rate

    The Q2 2025 GDP growth rate of 3.8% is a solid print, well above expectations.


    1๏ธโƒฃ Fed Policy Implications

    • Stronger-than-expected growth reduces the likelihood of immediate rate cuts.
    • If inflation remains above target, the Fed could pause easing or even signal caution for future cuts.
    • Markets may now price fewer total rate cuts in 2025, especially in October and December.

    2๏ธโƒฃ Stock Market Implications

    • Cyclicals benefit: Industrials, materials, consumer discretionary, tech hardware/semiconductors may rally.
    • Defensives lag: Utilities, REITs, consumer staples underperform in a strong-growth environment.
    • Rate-sensitive tech: High-multiple growth stocks may face short-term pressure if the market thinks Fed cuts will be smaller or slower.

    3๏ธโƒฃ Bond Market Implications

    • Treasury yields rise, particularly in the short- and intermediate-term, as expectations for Fed cuts decline.
    • Bond prices fall as yields climb.

    4๏ธโƒฃ Currency & Commodities

    • USD strengthens: Strong growth attracts global investment flows.
    • Gold declines: Higher yields reduce safe-haven appeal.
    • Commodities/oil rise: Stronger growth signals higher demand.

    5๏ธโƒฃ Market Summary Table

    AssetLikely Reaction
    Stocks (cyclical)โ†‘
    Stocks (defensive)โ†“
    Bondsโ†“ (yields โ†‘)
    USDโ†‘
    Goldโ†“
    Commoditiesโ†‘

    Key takeaway: Q2โ€™s 3.8% GDP signals the U.S. economy is resilient, lowering the probability of aggressive Fed rate cuts. Cyclical sectors and commodities are poised to benefit, while bonds, gold, and defensive equities may see headwinds.

    Chance of a Recession this Year

    Short answer: Markets & big forecasters put the U.S. recession probability for the rest of 2025 roughly in the 30โ€“40% range today, but estimates vary from the low-teens up to the 50โ€“60% area depending on the model and timing of the call.

    Hereโ€™s a quick, sourced read on why that range is so wide and what could push it higher or lower.

    Why forecasters disagree

    • Different models & inputs. Some groups (Goldman, JPMorgan, IMF, private forecasters) weight trade/tariffs, payroll revisions, inflation, and financial-market signals differently โ€” producing Goldman โ‰ˆ30%, JPMorgan โ‰ˆ40% (recent update), and IMF/others ~40% estimates. (fi-desk.com)
    • Timing matters. A model that asks โ€œrecession in next 6 months?โ€ gives different odds than โ€œrecession this calendar year.โ€
    • Fast-changing data. Big downward payroll revisions, sticky core inflation prints, or new tariff moves rapidly change the odds (markets reprice in days).

    Key drivers that raise recession odds

    • Major, persistent labor weakness (continued big payroll downgrades or rising unemployment).
    • A sharp earnings and hiring pullback that feeds into consumer spending declines.
    • Policy confusion โ€” sticky inflation plus weak growth could force the Fed into a painful tradeoff (no cut = growth hit; cut = inflation re-acceleration).
    • Escalating trade or geopolitical shocks that damage exports/supply chains. (Federal Reserve)

    Key drivers that lower odds

    • Inflation falling more clearly (PPI/CPI/PCE easing), giving the Fed room for orderly cuts and supporting demand.
    • Resilient corporate capex, especially AI-related investment, keeping jobs and earnings supported.
    • Trade de-escalation or fiscal support that offsets private weakness. (IMF)

    Market implications if odds rise vs fall

    • Odds rise (recession more likely): bonds rally (yields โ†“), gold and safe havens โ†‘, cyclical equities and financials underperform, tech/quality may initially rally on rate cuts but could fall if earnings deteriorate.
    • Odds fall (soft landing more likely): equities rally broadly (tech + cyclicals), yield curve may steepen moderately, USD softens.

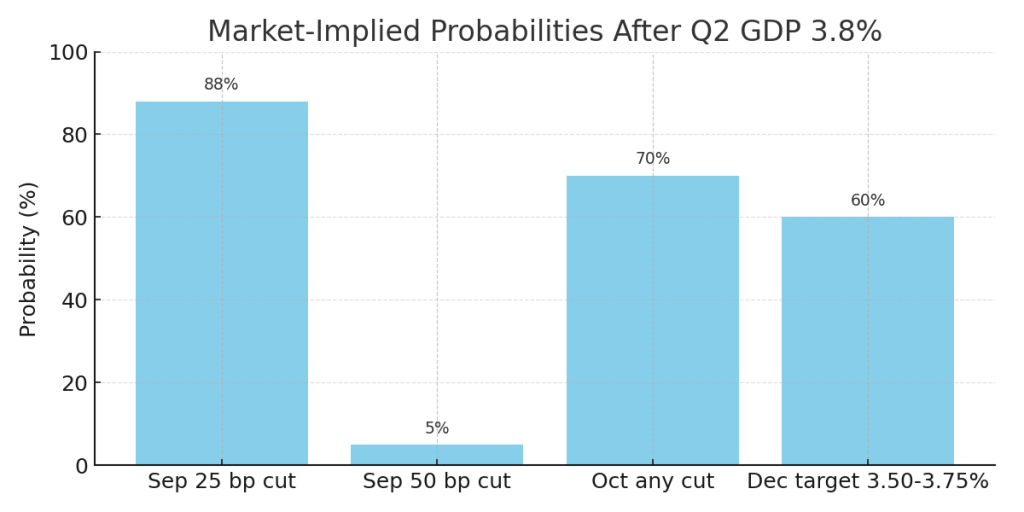
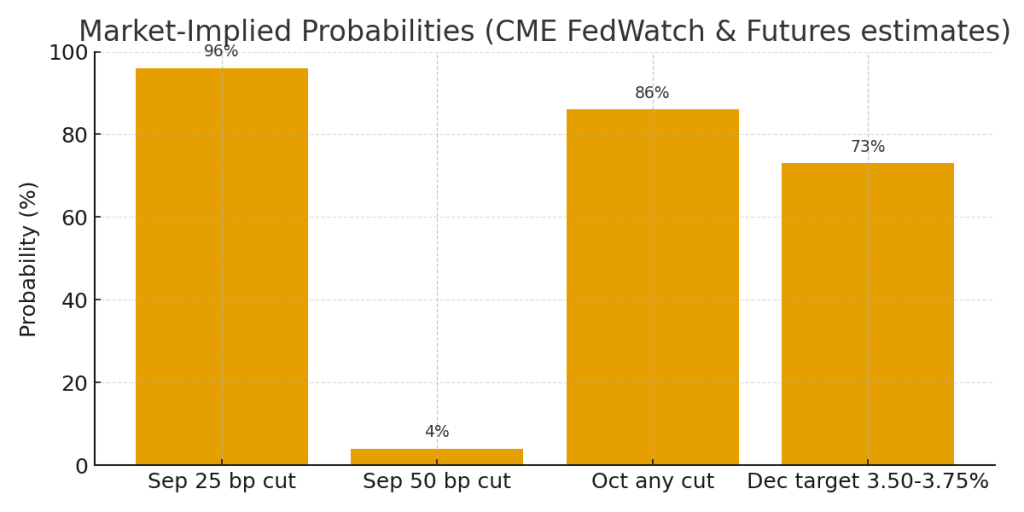
    1) Market-implied probabilities (what markets are pricing now)

    • September 2025 meeting (next FOMC)
      • ~95โ€“96% probability of a 25 bps cut (i.e., markets expect a quarter-point cut). (CME Group)
    • October 2025 meeting
      • Odds for another cut in October have jumped โ€” Reuters notes futures lifted chances for easing in October to ~86% after the September cut. (Reuters)
    • Total easing priced for 2025 (by year-end)
      • Markets are pricing roughly ~60โ€“80 bps of cuts in total for 2025 (i.e., 2โ€“3 quarter-point cuts including the one in September). Many futures-based trackers and analysts converge around ~70 bps of cuts priced in for the remainder of the year. (Reuters)
    • Probability of a โ€œjumboโ€ 50 bps cut in September
      • Still low but non-zero โ€” generally ~5โ€“10% depending on the source. Statista / CME snapshots and news pieces put this in single digits. (Statista)
    • Recession probability context
      • Major banksโ€™ published recession probabilities are clustered in the ~30โ€“40% range for a U.S. recession within the next 12 months, though models vary. (Markets and some houses earlier priced higher and then trimmed odds as data evolved). (JPMorgan Chase)

    2) Two scenario models and the expected market reactions

    Iโ€™ll show each scenario, how likely markets currently think it is, the immediate asset reactions, sector winners/losers, and suggested portfolio tilts and risk controls.


    Scenario A โ€” Soft Landing (base / market-priced)

    Probability (market-implied): ~50โ€“65% (markets are leaning toward this via FedWatch + futures pricing). (CME Group)

    Description: Fed cuts ~25 bps in Sept and another 25 bps later in 2025; inflation drifts lower, jobs stabilize (no large spike in unemployment), growth slows but remains positive.

    Immediate asset moves (days โ†’ weeks):

    • Stocks: Mild-to-moderate rally; tech, growth, REITs and small caps outperformance.
    • Bonds: Short-term yields fall (2-yr down), long yields drift down less โ†’ yield curve steepens modestly.
    • Dollar: Modestly weaker.
    • Gold: Rises modestly.
    • Commodities/Oil: Mixed; oil steadies on demand hopes.

    Sector winners / losers

    • Winners: Tech/AI/semi equipment, housing/REITs, consumer discretionary, small caps.
    • Losers/underperformers: Short-duration financials (some margin compression), defensives (utilities/staples) may lag.

    Portfolio tilt (example, tactical 3-month):

    • Equities: +5โ€“10% overweight growth/tech & select cyclical exposure.
    • Bonds: +5โ€“10% overweight high-quality duration (2โ€“7 year Treasuries).
    • Cash: Trim โ€” 5% buffer to buy dips.
    • Gold: +2โ€“4% as insurance.

    Risk management:

    • Keep stops or hedges on concentrated tech positions (market is sensitive to guidance).
    • Ladder Treasuries (reduce reinvestment shock).

    Scenario B โ€” Hard Landing / Recession Risk

    Probability (market-implied tail risk): ~20โ€“35% (markets price a nontrivial chance; some forecasters place odds higher ~30โ€“40%). (JPMorgan Chase)

    Description: Despite cuts (25โ€“50 bps total), payroll revisions/ongoing weakness push unemployment higher, corporate earnings degrade. Cuts are seen as reactive, not preventive โ†’ growth contracts.

    Immediate asset moves:

    • Stocks: Short-term rally on initial dovish surprise may give way to a broader equity selloff as earnings forecasts get cut. Cyclicals and small caps hit hardest.
    • Bonds: Strong rally (yields fall across curve), 2-yr falls sharply as Fed cuts are front-loaded.
    • Dollar: Initially weak on cuts, but can become volatile โ€” in a global risk-off the USD can strengthen as a safe haven.
    • Gold: Strong safe-haven demand โ†’ substantial gains.
    • Commodities/Oil: Fall on demand worries.

    Sector winners / losers

    • Winners: High-quality long duration bonds, gold, consumer staples/defensive healthcare, select utilities.
    • Losers: Banks (credit cycle & NIM pressure), capital goods, industrial cyclical names, energy (lower demand).

    Portfolio tilt (defensive 3-month):

    • Equities: Reduce exposure; shift toward quality dividend payers + defensives. (e.g., 30โ€“40% equity allocation instead of 60% baseline).
    • Bonds: Increase allocation to high-quality Treasuries and investment-grade corporates; overweight duration (2โ€“10y).
    • Cash / Liquidity: Step up to 10โ€“15% for optionality.
    • Gold: Increase to 5โ€“8% as hedge.
    • Alternative hedges: Consider small allocation to tail-risk hedges (protective puts, managed futures).

    Risk management:

    • Trim levered / highly cyclical exposures quickly on signs of earnings downgrades.
    • Monitor credit spreads (if spreads widen, reduce credit risk).

    Practical what to watch next (data & market signals that should change odds)

    • Weekly jobless claims & next payrolls โ€” if claims rise and payrolls remain weak, Hard Landing odds increase.
    • Core CPI / PCE prints โ€” sticky inflation reduces the Fedโ€™s ability to cut more, lowering Soft Landing odds.
    • Fed communications & dots โ€” if dot plot keeps signaling cuts, markets price them in; hawkish tone can reverse expectations fast. (Reuters)
    • Credit spreads & high-yield performance โ€” early warning of stress; widening spreads point to higher recession risk.
    • Equity breadth and earnings revisions โ€” broad downgrades imply growth risk.

    Quick action checklist (if you manage money)

    1. Re-check position size in tech/growth โ€” theyโ€™re most sensitive to a Fed policy surprise.
    2. Ladder into longer-duration Treasuries or a short-duration bond ladder if you want yield + safety.
    3. Keep cash buffer (5โ€“15%) to buy quality on weakness.
    4. Use stop loss or protective options for concentrated bets โ€” a small premium buys big asymmetric protection.
    5. Track the five key data points weekly (jobs, CPI/PCE, claims, credit spreads, Fed speak).

    Sources and evidence (most important market-facing references)

    • CME FedWatch (market-implied probabilities for Fed moves). (CME Group)
    • Reuters reporting on futures boosting the odds of further easing after the Sept cut. (Reuters)
    • CBS / Statista snapshots summarizing cut probabilities (95โ€“96% for Sept 25 bps). (CBS News)
    • J.P. Morgan analysis on recession probability shifts. (JPMorgan Chase)
    • CME rates recap showing elevated futures positioning and activity. (CME Group)

    Will the Feds cut rates again this year?

    Based on the latest information, itโ€™s quite likely that the Fed will cut rates at least a couple more times this year. Hereโ€™s a breakdown of the evidence, the Fedโ€™s stance, and what could make cuts more or less likely:


    โœ… Why More Cuts Are Likely

    1. Recent Cut + Dot Plot Projections
      After cutting the fed funds rate by 25 basis points (bps), Fed officials projected two more quarter-point cuts for the remainder of 2025. (Reuters)
    2. Economic Indicators Softening
      The labor market is weakening (job growth slowing, revisions showing far fewer jobs added), which shifts the Fedโ€™s risk assessment toward downside risks for employment. (Reuters)
      Inflation remains above target but hasnโ€™t been accelerating aggressively, giving the Fed some leeway. (Federal Reserve)
    3. Market Expectations
      Futures markets and major banks are leaning toward more cuts. For example, JPMorgan sees a strong chance of another 25-bps cut, and some analysts believe there could be three or more cuts into early 2026. (Business Insider)

    โš ๏ธ What Could Prevent or Limit Further Cuts

    • If inflation (especially core PCE or CPI) remains stubbornly high or turns up again, that could make the Fed more cautious.
    • Stronger-than-expected economic data (GDP growth, consumer spending, manufacturing) might reduce pressure to ease.
    • Global risks or shocks (e.g. energy price spikes, geopolitics, trade policy issues) that push up inflation or disrupt supply chains.
    • Concerns about losing credibility in inflation control could push the Fed to move slower.

    ๐Ÿ“Š What to Expect

    Hereโ€™s a rough timeline and what markets are pricing in:

    • Two more 25-bps cuts during the rest of 2025, likely at upcoming FOMC meetings. (Reuters)
    • Possible one more cut in early 2026, depending on how inflation and labor market data evolve. (Federal Reserve)

    What Does Latest Rate Cut Mean?

    The Feds just cut interest rates by 25 basis point (bp). Hereโ€™s what that signals and how it ripples out:


    ๐Ÿฆ Economic Meaning

    • Cheaper Credit: Mortgages, auto loans, and business loans gradually become cheaper.
    • Stimulus: Encourages spending and investment, aiming to support slowing growth.
    • Confidence Signal: A 25 bp cut is a measured step โ€” not panic, but a sign the Fed sees the economy softening.
    • Inflation Watch: The Fed is easing, but carefully โ€” theyโ€™re not sure inflation is fully under control.

    ๐Ÿ“Š Market Impact

    • Stocks: Generally bullish โ€” especially for growth/tech and real estate. But if investors think the cut means a looming recession, gains may fade.
    • Bonds: Short-term yields fall most, boosting bond prices. Long-term yields may fall too if growth fears rise.
    • U.S. Dollar: Slightly weaker โ€” lower yields make USD less attractive.
    • Gold/Commodities: Gold often rises (lower real yields), oil/metals can benefit if growth looks supported.
    • Banks: Mixed โ€” loan demand improves, but margins may narrow.

    โš–๏ธ Context

    • If inflation is falling, this cut looks supportive โ†’ โ€œsoft landingโ€ optimism.
    • If inflation is still sticky, the cut risks fueling more price pressures โ†’ markets may get nervous.

    โœ… Bottom line:
    A 25 bp cut is the Fedโ€™s way of saying: โ€œWe see the economy slowing, but weโ€™re not in crisis mode.โ€ Itโ€™s a supportive move, not a rescue move.


    What to Expect from a Potential Fed Rate Cut this week

    When the Fed cuts rates, the market reacts differently depending on why the cut is happening (growth slowdown vs. financial stress vs. inflation under control). But hereโ€™s the typical playbook:


    ๐Ÿ“‰ Bonds

    • Short-term Treasuries (2Y, 5Y): Yields drop the most โ€” directly tied to Fed policy.
    • Long-term Treasuries (10Y+): Can fall too, but if markets worry about inflation, the drop is smaller.
    • โœ… Net: Bond prices rise, especially in the short end.

    ๐Ÿ“ˆ Stocks

    • Growth / Tech: Big winners โ†’ lower discount rates boost valuations.
    • Small Caps: Benefit from cheaper borrowing costs.
    • Financials: Mixed โ†’ lower rates can compress bank margins, but more loan demand helps.
    • Defensives (utilities, staples): Often lag in a rate-cut rally.
    • โœ… Net: Stocks rally short term, but if cuts signal recession fears, gains can fade.

    ๐Ÿ’ต U.S. Dollar

    • Rate cuts usually weaken the dollar (lower yields make USD less attractive).
    • But if other economies are weaker, the dollar can still hold up.

    ๐Ÿช™ Gold & Commodities

    • Gold: Bullish โ€” lower real yields + weaker USD.
    • Oil / Industrial metals: Could rise if cuts are seen as boosting demand.

    โš–๏ธ Context Matters

    • Soft Landing Cut (inflation down, economy stable): Markets cheer โ†’ risk assets surge.
    • Recession Cut (jobs + growth collapse): Initial rally, then volatility as earnings outlook worsens.

    โœ… Bottom line:

    • Near-term: Stocks and bonds likely rally, USD softens, gold rises.
    • Medium-term: Market reaction depends on whether the cut is a โ€œconfidence boostโ€ (bullish) or a โ€œpanic cutโ€ (bearish).

    Hereโ€™s a scenario matrix for the upcoming Fed decision, given the backdrop of weak jobs + sticky inflation:


    ๐Ÿ“Š Fed Rate Cut Scenarios & Market Reactions


    1) 25 bps Cut (Base Case / Cautious Easing)

    • Stocks โ†’ Mild rally. Growth/tech up, but not euphoric since it looks cautious.
    • Bonds โ†’ Short-term yields drop modestly, curve stays inverted.
    • USD โ†’ Slightly weaker, but not a major selloff.
    • Gold โ†’ Edges higher (real yields lower).
    • Message โ†’ Fed balancing act โ†’ โ€œWeโ€™re watching inflation, but also supporting jobs.โ€
      โœ… Market interprets as a measured soft-landing approach.

    2) 50 bps Cut (Dovish Surprise)

    • Stocks โ†’ Initial surge (risk-on). Tech + small caps lead.
    • Bonds โ†’ Big rally in short-term Treasuries, yields drop fast.
    • USD โ†’ Weaker โ€” carry trade flows out of USD.
    • Gold & Commodities โ†’ Spike higher (gold: real yields collapse, oil/commodities: demand optimism).
    • Message โ†’ Fed more worried about growth than inflation.
      โš ๏ธ Market may later question: โ€œDo they know something worse about the economy?โ€

    3) No Cut (Hawkish Hold)

    • Stocks โ†’ Selloff, especially growth/tech. Cyclicals under pressure.
    • Bonds โ†’ Short-end yields jump โ†’ curve flattens/inverts more.
    • USD โ†’ Strengthens โ†’ global risk-off.
    • Gold โ†’ May hold up (as risk hedge), but no strong rally.
    • Message โ†’ Fed prioritizing inflation fight over jobs.
      โš ๏ธ Market sees this as policy risk โ†’ tightening into slowdown.

    ๐Ÿ”‘ Big Picture

    • A 25 bps cut is most likely and would calm markets.
    • A 50 bps cut sparks a short-term rally but raises recession fears later.
    • No cut shocks markets โ†’ likely worst short-term outcome for equities.

    Great โ€” hereโ€™s a sector-by-sector breakdown for the 3 Fed rate cut scenarios:


    ๐Ÿ“Š Sector Impact by Fed Cut Scenario


    1) 25 bps Cut (Measured Easing โ€“ Base Case)

    • Tech / Growth: โœ… Positive, steady rally as discount rates ease.
    • Financials (Banks): โš–๏ธ Mixed โ€” loan demand improves, but margins narrow a bit.
    • Energy / Materials: โž• Mildly positive if demand outlook stabilizes.
    • Real Estate (REITs, housing): โœ… Relief โ€” borrowing costs dip slightly.
    • Consumer Discretionary: โž• Positive โ€” cheaper credit supports spending.
    • Utilities / Staples: โš ๏ธ Laggards โ€” less defensive demand in a modest risk-on environment.

    2) 50 bps Cut (Dovish Surprise โ€“ Aggressive Easing)

    • Tech / Growth: ๐Ÿš€ Big winners, as valuations re-rate higher.
    • Financials (Banks): โŒ Negative โ€” sharp margin compression, weak outlook for profitability.
    • Energy / Materials: โœ… Strong upside โ€” demand optimism and weaker USD boost commodities.
    • Real Estate: ๐Ÿš€ Big rally โ€” mortgage rates drop more aggressively.
    • Consumer Discretionary / Small Caps: ๐Ÿš€ Strong โ€” cheap credit + weaker USD helps exporters.
    • Utilities / Staples: โš ๏ธ Underperform โ€” money flows into growth sectors instead.

    3) No Cut (Hawkish Hold โ€“ Surprise)

    • Tech / Growth: โŒ Hit hard โ€” higher discount rates weigh on valuations.
    • Financials: โœ… Slightly positive โ€” higher rates protect bank margins.
    • Energy / Materials: โŒ Weak โ€” growth slowdown fears outweigh any inflation hedge play.
    • Real Estate: โŒ Selloff โ€” mortgage rates remain high, housing demand weakens.
    • Consumer Discretionary: โŒ Negative โ€” consumers squeezed by higher borrowing costs.
    • Utilities / Staples: โœ… Defensive inflows โ€” investors rotate to safe havens.

    ๐Ÿ”‘ Takeaway

    • 25 bps = โ€œsteady glide pathโ€ โ†’ broad but modest rally.
    • 50 bps = โ€œall-in easingโ€ โ†’ growth sectors rip, but banks suffer.
    • No cut = โ€œhawkish surpriseโ€ โ†’ broad equity selloff, defensives + banks hold up best.

    Potential Market Reaction to Recent BLS Jobs Report

    BLS made a 911,000 downward revision to U.S. payrolls. It is one of the largest in recent memory. Hereโ€™s how that shock ripples across markets:


    ๐Ÿ“‰ What the Revision Means

    • Labor market not as strong as thought โ†’ hiring overstated, economy weaker.
    • Signals slowdown in consumer spending, housing demand, and business investment.
    • Fed implications โ†’ gives the Fed cover to cut rates more aggressively.

    ๐Ÿ“Š Market Impact Breakdown

    Stocks

    • Rate-sensitive sectors (tech, housing, REITs): Likely to pop higher on lower-rate expectations.
    • Cyclicals (industrials, consumer discretionary, energy): Could struggle โ€” weaker demand outlook.
    • Financials: Negative โ€” banks face weaker loan demand + margin pressure if cuts accelerate.
    • Overall: Short-term rally, but longer-term risk of recession-driven correction.

    Bonds

    • Treasuries rally hard โ€” especially 2Y and 5Y.
    • Yield curve steepens โ†’ short-term yields fall more than long-term as markets price in cuts.
    • Fed funds futures may start pricing a 50 bps cut sooner.

    U.S. Dollar

    • Likely weaker โ€” Fed seen as easing faster.
    • But if recession fears rise, safe-haven flows could bring volatility.

    Gold & Commodities

    • Gold ๐Ÿš€ bullish โ€” weaker dollar + lower yields + safe-haven demand.
    • Oil & industrial metals: Bearish โ€” softer jobs = weaker demand outlook.

    โš–๏ธ Big Picture

    • The revision changes the narrative:
      • Before: โ€œLabor market resilient, Fed cautious.โ€
      • Now: โ€œLabor market weaker, Fed must cut.โ€
    • Markets may cheer at first (dovish pivot) but risk shifting to โ€œhard landingโ€ fears if hiring proves much weaker across sectors.

    โœ… Bottom line:

    • Bonds and gold = clear winners.
    • Tech & housing = near-term winners.
    • Cyclicals, banks, energy = under pressure.
    • Raises odds of a larger September rate cut (50 bps) and puts recession risk front and center.

    Got it ๐Ÿ‘ โ€” hereโ€™s a 3-month market outlook (Sept โ†’ Dec 2025) now that the BLS has revised payrolls down by 911,000 jobs.


    ๐Ÿ“Š 3-Month Market Outlook After Jobs Revision


    ๐Ÿฆ Stocks

    • Near Term (Septโ€“Oct):
      • Tech, housing, REITs rally on lower-rate expectations.
      • Financials & cyclicals underperform (weaker loan growth, demand concerns).
      • S&P 500 may bounce short term, but gains could fade if earnings guidance weakens.
    • By Year-End:
      • If Fed cuts 50 bps and inflation stays tame โ†’ rally resumes.
      • If hiring keeps collapsing โ†’ hard landing correction (10%+ drawdown risk).

    ๐Ÿ“ˆ Bonds

    • Short-term (2Y): Yields drop sharply (pricing multiple cuts).
    • Long-term (10Y+): Yields drift lower but less dramatically โ†’ yield curve steepens.
    • By Year-End: Treasuries remain bid as investors hedge recession; safest asset class near term.

    ๐Ÿ’ต U.S. Dollar

    • Near Term: Weakens as markets bet on faster Fed easing.
    • Later (Novโ€“Dec): If recession fears deepen globally, dollar could rebound on safe-haven demand.
    • Outlook = volatile, but bias is downside vs. major currencies (EUR, JPY, CNY) in Q4.

    ๐Ÿช™ Gold & Commodities

    • Gold: Big winner โ†’ benefits from lower yields + weaker USD + safe-haven flows. Could test all-time highs this fall.
    • Oil & industrial metals: Bearish bias โ€” softer labor market = weaker demand outlook. Watch for OPEC+ cuts as a stabilizer.

    โš–๏ธ Scenario Paths

    1. Soft Landing (Fed cuts 25โ€“50 bps, growth stabilizes)

    • Stocks: Recover into year-end (tech, housing lead).
    • Bonds: Stay supported, curve steepens.
    • Dollar: Weak.
    • Gold: High, but stabilizes.

    2. Hard Landing (Fed cuts, but jobs keep sliding)

    • Stocks: Drop 10โ€“15% as earnings estimates are cut.
    • Bonds: Strong rally (2Y < 3%).
    • Dollar: Whipsaws โ€” weak on cuts, strong if crisis fear rises.
    • Gold: ๐Ÿš€ Best performer (safe-haven + falling yields).

    โœ… Bottom Line:

    • Next 1โ€“2 months: Expect a risk rally (tech, housing, gold, bonds up).
    • Late Q4: Depends on jobs trend โ†’ if hiring keeps slowing, recession trades dominate (bonds & gold keep winning, stocks pull back).

    Market Effects of a Potential Fed Rate Cut

    A Fed rate cut is one of the most powerful policy levers in markets. Hereโ€™s a breakdown of how it tends to affect different parts of the financial system โ€” and why Septemberโ€™s potential cut is being watched so closely:


    ๐Ÿ“Š 1. Stock Market

    • Bullish for equities (in theory):
      • Lower borrowing costs โ†’ boosts corporate profits.
      • Higher valuations as future earnings are discounted at lower rates.
      • Rate-sensitive sectors (tech, housing, utilities) usually rally.
    • Caution:
      • If the Fed is cutting because the economy is weakening, stocks may struggle (a โ€œbad news = bad newsโ€ scenario).

    ๐Ÿ’ต 2. Bond Market

    • Treasury bonds: Prices rise, yields fall as investors anticipate easier policy.
    • Corporate bonds: Borrowing costs decline โ†’ better conditions for refinancing debt.
    • Yield curve: Cuts often steepen the curve (short-term yields fall faster than long-term).

    ๐Ÿ’ฒ 3. U.S. Dollar (Forex)

    • Lower rates make U.S. assets less attractive โ†’ dollar typically weakens.
    • A weaker dollar benefits exporters and multinational companies.

    ๐Ÿช™ 4. Gold & Commodities

    • Lower yields reduce the opportunity cost of holding gold โ†’ bullish for gold.
    • Weaker dollar also lifts commodities priced in dollars (oil, metals, agriculture).

    ๐Ÿ  5. Housing & Real Economy

    • Mortgage rates fall โ†’ more affordability for buyers, possible rebound in housing demand.
    • Businesses face lower financing costs โ†’ more capital spending.
    • Consumers pay less on credit cards, auto loans โ†’ improved spending power.

    โš–๏ธ Market Context Right Now (Sept 2025)

    • Why the Fed might cut: Weak jobs report (22k jobs added, rising unemployment), slowing housing market, cooling inflation.
    • Whatโ€™s priced in: Markets expect at least 25 bps, some betting on 50 bps.
    • Risk: If cuts are seen as a response to serious economic weakness, the initial rally could fade as recession fears rise.

    โœ… Bottom line:

    • A Fed cut usually boosts stocks, bonds, and gold while weakening the dollar.
    • The marketโ€™s reaction depends on the narrative:
      • โ€œSoft landingโ€ โ†’ bullish (rate cuts extend growth).
      • โ€œHard landingโ€ โ†’ bearish (cuts canโ€™t stop a slowdown).

    ๐Ÿ“Š Fed Rate Cut Scenarios & Market Impact

    Fed Decision (Sept 2025)StocksBonds (Yields)U.S. DollarGold & CommoditiesNarrative / Market Mood
    25 bps cut (base case)๐Ÿ“ˆ Mild rally, especially in tech, housing, utilities. Banks mixed.Yields drift lower (esp. 2-yr). Curve steepens slightly.Weakens modestly.Gold up modestly, oil supported by weaker dollar.โ€œMeasured easingโ€ โ†’ soft landing hopes.
    50 bps cut (dovish surprise)๐Ÿš€ Strong rally in growth stocks & housing. Cyclicals mixed (fear of slowdown).Yields plunge, bonds surge.Weakens sharply.Gold spikes toward new highs; commodities broadly higher.โ€œEmergency cutโ€ โ†’ could cheer markets short-term but raise recession concerns.
    No cut (hawkish surprise)๐Ÿ“‰ Stocks drop, esp. rate-sensitive tech & REITs.Yields jump higher; bond selloff.Strengthens sharply.Gold falls; oil down on stronger dollar.โ€œFed behind the curveโ€ โ†’ risk-off, higher volatility.

    โš–๏ธ How to Read This

    • 25 bps cut: Easiest for markets to digest โ€” dovish enough to support assets, not panicky.
    • 50 bps cut: Big near-term boost for risk assets (stocks, gold), but raises questions: Is the economy worse than expected?
    • No cut: Would shock markets โ€” likely selloff across stocks and bonds, stronger dollar, and higher volatility.

    โœ… Bottom line:

    • If the Fed cuts 25 bps, markets rally steadily.
    • If it cuts 50 bps, markets pop big but may wobble as traders debate โ€œhard landingโ€ risk.
    • If no cut, expect a sharp correction.

    Hereโ€™s the sector-by-sector breakdown for each Fed rate cut scenario at the September meeting:


    ๐Ÿฆ Sector Playbook: Fed Cut Scenarios

    Fed DecisionTech (AI, semis, cloud)Financials (banks, insurers)Housing / REITsEnergy / CommoditiesDefensives (healthcare, utilities, staples)
    25 bps cut (base case)๐Ÿš€ Boosted (lower discount rates, cheaper capital).Mixed โ€” loan margins shrink, but stable outlook.๐Ÿ“ˆ Positive โ€” lower mortgage rates spur demand.Mildly positive from weaker dollar.Stable, modest gains.
    50 bps cut (dovish surprise)๐Ÿš€๐Ÿš€ Big rally โ€” growth stocks thrive.๐Ÿ˜ฌ Negative โ€” sharp margin compression, signals weak economy.๐Ÿš€ Strong rebound โ€” mortgages cheaper, REITs soar.Commodities rally (weak USD), but recession fears cap oil.๐Ÿ“ˆ Strong bid as investors hedge slowdown risk.
    No cut (hawkish surprise)๐Ÿ“‰ Sharp selloff โ€” most sensitive to higher rates.๐Ÿ“ˆ Positive for banks (wider margins), insurers benefit.๐Ÿ“‰ Hit hard โ€” housing demand weakens.Oil & commodities fall on strong dollar.๐Ÿ“ˆ Attract flows as safe havens.

    โš–๏ธ Key Insights

    • Tech & Housing = biggest winners if the Fed cuts.
    • Banks: Do best if no cut (higher margins), but struggle under larger cuts.
    • Energy: Moves more with global demand; a weaker dollar supports oil & metals, but slowdown risk offsets.
    • Defensives: Attract flows in both 50 bps cut (recession fears) and no cut (risk-off) scenarios.

    โœ… Bottom Line:

    • 25 bps cut โ†’ Balanced bullishness. Tech + housing lead, market stable.
    • 50 bps cut โ†’ Explosive rally in growth/housing, but signals possible recession โ†’ defensives also rise.
    • No cut โ†’ Tech & housing slump, banks & defensives outperform.

    ๐Ÿ“Š Fed Rate Cut Scenarios: Full Portfolio Impact

    Fed DecisionStocksBonds โ€“ Short-Term (2Y)Bonds โ€“ Long-Term (10Y+)U.S. DollarGold & CommoditiesMarket Mood
    25 bps cut (base case)๐Ÿ“ˆ Mild rally (tech + housing strongest).๐Ÿ“‰ Yields fall modestly โ†’ prices rise.๐Ÿ“‰ Yields edge lower โ†’ curve steepens slightly.Weaker, but not sharply.Gold + commodities tick higher.โ€œSoft landing still alive.โ€
    50 bps cut (dovish surprise)๐Ÿš€ Growth stocks + REITs surge; banks pressured.๐Ÿ“‰๐Ÿ“‰ Yields plunge โ€” bonds rip higher.๐Ÿ“‰ Yields drop, but less than 2Y โ†’ strong steepening.Sharp weakening.Gold spikes ๐Ÿš€; oil + metals rise.โ€œEmergency easingโ€ โ†’ short-term euphoria, recession worries linger.
    No cut (hawkish surprise)๐Ÿ“‰ Selloff โ€” tech + housing hit hardest.๐Ÿ“ˆ Yields jump โ€” bonds sell off.๐Ÿ“ˆ Yields rise, but less than 2Y โ†’ curve flattens.Dollar strengthens strongly.Gold + commodities drop.โ€œFed behind the curveโ€ โ†’ risk-off, volatility spike.

    โš–๏ธ Bond Market Mechanics

    • Short-term bonds (2Y) move most with Fed expectations. Cuts โ†’ strong rally; no cut โ†’ steep losses.
    • Long-term bonds (10Y+) move more with growth/inflation outlook. Cuts steepen curve (2Y down faster), while no cut flattens curve.
    • Steepening curve โ†’ suggests policy easing; flattening โ†’ markets fear growth slowdown or tight policy.

    โœ… Big Picture Takeaway

    • 25 bps cut: Best-case balance โ†’ steady stock rally, moderate bond gains, stable dollar weakness.
    • 50 bps cut: Short-term party for stocks, bonds, and gold, but could spark โ€œWhy so aggressive?โ€ recession fears.
    • No cut: Risk-off across equities/commodities, bonds and dollar diverge (bonds down, USD up).

    How will the recent job report affect the markets

    Hereโ€™s how the August U.S. jobs report shook up the markets and what it means going forward:


    Key Takeaways from the Job Report

    Weakest Job Growth in Years

    • In August, the U.S. added just 22,000 jobs, a stark miss compared to the ~75,000 forecast and a sharp slowdown from earlier months.
    • Juneโ€™s data was revised into a 13,000 job loss, marking the first decline since 2020.
    • The unemployment rate rose to 4.3%, the highest since 2021.
    • Manufacturing continues to struggle, shedding jobs for four months in a row.

    Market Reactions & Investor Sentiment

    Equities

    • Initial uplift: Stock futures rose as weaker job data reinforced expectations for a Fed rate cut.
    • Volatility kicked in: Though equities briefly neared record highs, markets pulled back as the weakness raised broader slowdown concerns.

    Bonds & Yields

    • Yields plunged:
      • 2-year Treasury yield dropped to around 3.47%.
      • 10-year yield fell to roughly 4.07%, nearing April lows.
    • Investors rushed into Treasuries, signaling strong demand for safer assets.

    U.S. Dollar & Gold

    • Dollar weakened, reflecting lower interest rate expectations.
    • Gold soared, hitting new highs near $3,600/oz, driven by rate-cut expectations and safe-haven flows.

    Fed Rate Cut Expectations

    • Markets now strongly expect a September rate cut, with many pricing in a 25-basis-point cut and some even betting on a 50-basis-point move.

    Summary Table

    Asset / IndicatorMarket Reaction / Outlook
    StocksBrief rally then retraction; mixed sentiment persists.
    Bonds (Yields)Yields tumbled as investors anticipated Fed easing.
    U.S. DollarWeakened amid outlook for softer monetary policy.
    GoldSurged to new highs on safe-haven demand and rate cut bets.
    Fed PolicyRate cut in September now almost certain; some expecting larger movement.

    Bottom Line

    The soft August jobs report has reinforced the narrative that the labor market is coolingโ€”which the Fed is unlikely to ignore. While markets were initially buoyed by rate-cut prospects, underlying economic concerns remain real. The bond market and gold responded strongly, while equity markets remain sensitive to incoming data and Fed signals.