The 2026 U.S.-Iran Peace Accord: Macroeconomic Implications for Global Markets

On June 14, 2026, the United States and Iran finalized an interim peace agreement mediated by Pakistan, ending a volatile four-month regional conflict. While the primary relief is geopolitical, the economic ripple effects will fundamentally alter global supply chains, energy markets, and monetary policy trajectories.

For macroeconomic analysts, this accord represents a massive supply-side shock. Here is a breakdown of every core economic and structural catalyst outlined in the deal and their anticipated impact on global markets.

1. Complete Breakdown of the Accord’s Terms

The interim agreement, which serves as a binding memorandum of understanding, contains six non-negotiable pillars that take immediate effect ahead of the formal signing ceremony in Switzerland on Friday, June 19, 2026:

  • Immediate Ceasefire: Permanent termination of military operations on all fronts, including conflicts involving Hezbollah in Lebanon, stripping the structural “war premium” out of global commodity markets.
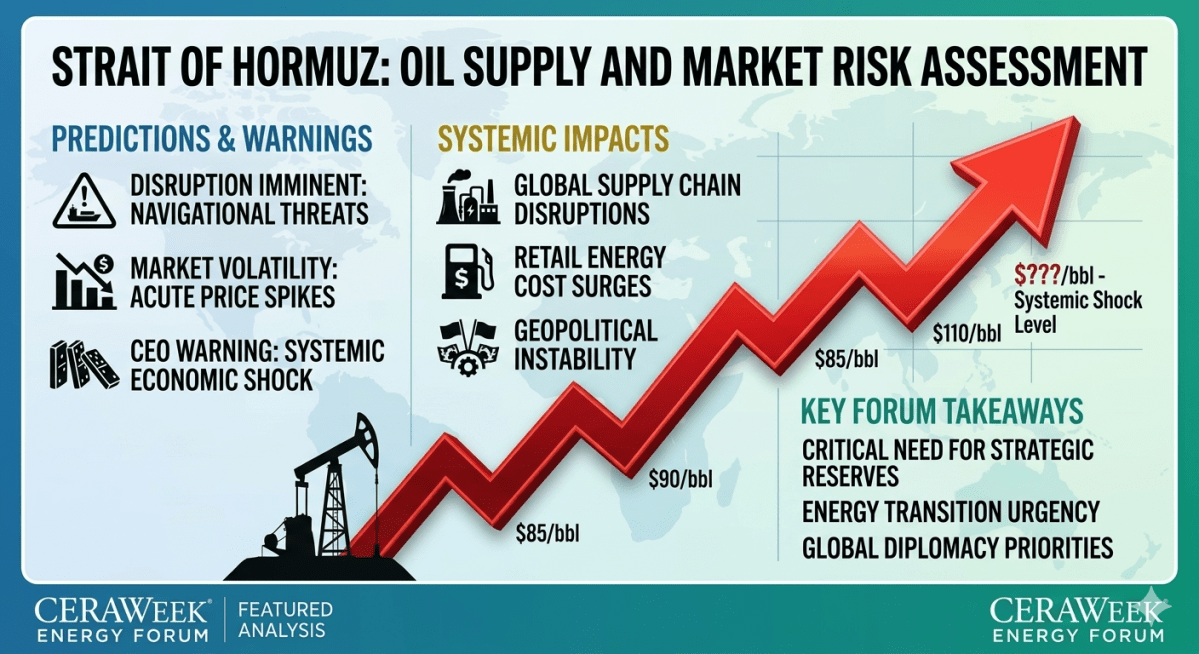
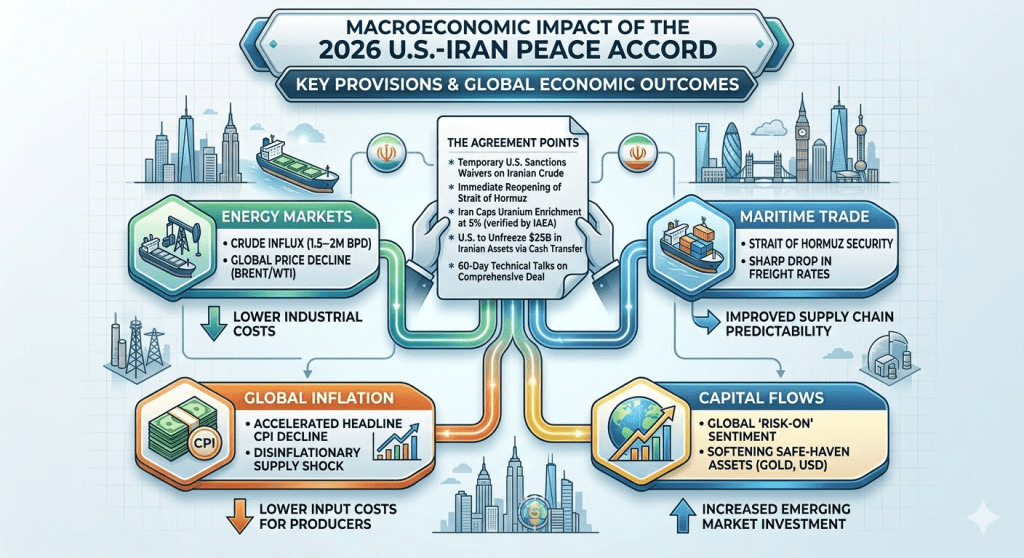
  • Reopening the Strait of Hormuz: Iran must immediately open the maritime corridor to all commercial vessels, eliminating severe logistics bottlenecks.
  • Lifting the Naval Blockade: U.S. President Donald Trump authorized the complete removal of the U.S. naval blockade on Iran, restoring normal shipping lane capacity.
  • Oil Sanctions Waivers: The U.S. will temporarily waive oil sanctions, legally allowing Iran to inject 1.5 to 2 million barrels per day (bpd) back into the global supply.
  • $25 Billion Cash Transfer: The U.S. will release $25 billion in frozen Iranian assets via direct cash transfers, drastically shifting regional liquidity.
  • Nuclear Freeze & Stockpile Negotiation: Iran must immediately pause uranium enrichment and facility expansion. A strict 60-day window of technical talks begins now to negotiate the permanent destruction or dilution of its highly enriched uranium stockpile.

2. Market Impact Analysis

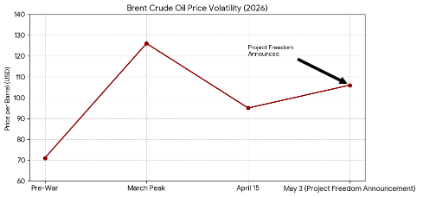
Energy Sector: A Sudden Supply Influx

The immediate legal flow of Iranian crude will heavily disrupt a tightly balanced global energy market. Expect rapid downward pressure on Brent and WTI crude futures. A sustained oil price drop acts as an organic, cross-border tax cut for importing nations, boosting consumer disposable income and lowering industrial input costs.

Supply Chains: Reopening the Global Chokepoint

The Strait of Hormuz handles roughly 20% of the world’s petroleum. Opening it instantly eliminates hyper-inflated war-risk insurance premiums for maritime shipping. Freight rates for tankers and container ships in the Middle East will plummet, alleviating lingering global transit inflation and restoring predictability to European and Asian supply chains.

Inflation and Central Bank Trajectories

Prior to the accord, central banks were bracing for stagflationary pressures driven by energy spikes. This disinflationary impulse will accelerate the decline of headline Consumer Price Index (CPI) metrics globally. Lower structural inflation gives the Federal Reserve and the European Central Bank (ECB) room to halt rate hikes or pivot toward monetary easing, supporting global GDP growth.

Capital Flows and Asset Reallocation

The $25 billion liquidity injection combined with geopolitical de-escalation will trigger a strong “risk-on” environment. Capital is expected to exit traditional safe havens like Gold and the U.S. Dollar, rotating back into emerging markets and global equities.

The Bottom Line

The 2026 U.S.-Iran Peace Accord is a net-positive supply shock for the global economy. By lowering energy costs, restoring vital trade corridors, and mitigating geopolitical risk premiums, the agreement provides a stabilizing anchor for global growth. However, long-term market stability hinges entirely on compliance during the next 60 days of technical nuclear talks.


Market analysis provided by The Macro Compass is for informational purposes only. Please consult with a financial advisor before making investment decisions.

The AI Cycle: Macroeconomic Optimism Meets the Reality of Capital Efficiency

The macroeconomic narrative surrounding artificial intelligence has shifted rapidly from structural euphoria to cyclical skepticism. During the first quarter of the year, financial markets were driven by unprecedented optimism regarding the transformative potential of generative AI infrastructure. Capital flooded into the technology sector, driving the valuations of semiconductor manufacturers and cloud providers to historic multiples. This surge was underpinned by a widespread belief that massive corporate investment in AI hardware would rapidly catalyze a secondary wave of high-margin software revenue. Wall Street effectively priced in a frictionless transition from capital expenditure to top-line growth, viewing AI not merely as an incremental technological upgrade, but as a near-term driver of macroeconomic productivity.

To illustrate this initial momentum, the chart below displays the significant upward trajectories experienced by major hardware, memory, and semiconductor providers—such as NVIDIA (NASDAQ:NVDA), Micron Technology (NASDAQ:MU), Intel Corp (NASDAQ:INTC), and SanDisk Corporation (NASDAQ:SNDK)—which served as the foundational “picks and shovels” during the peak of the Q1 hardware deployment strategy.

However, the latest corporate earnings season delivered a stark reality check to this capital-efficiency thesis. As major technology firms disclosed their financial results over the last few weeks, the market’s focus pivoted from future potential to immediate return on investment. While capital expenditure on data centers, specialized chips, and energy infrastructure continued to climb into the tens of billions of dollars, the corresponding revenue gains from AI deployment failed to scale at the expected velocity. This widening divergence between heavy capital deployment and slower-than-anticipated monetization has introduced a wave of risk aversion, sparking sharp valuation corrections among top-tier AI equities.

The Capital Asymmetry: Corporate Spending vs. Segment Returns

To better appreciate the friction facing tech sector balance sheets, we can look at the stark structural imbalances present within the current fiscal year guidance and the annualized revenue run-rates of the dominant market hyperscalers.

CompanyFY2026 Capital Expenditure GuidanceReported Q1 2026 Quarterly CapExAnnualized AI / Cloud Segment Revenue
Amazon (AWS)$200.0 Billion$43.2 Billion$150.4 Billion (AWS Total)
Microsoft$190.0 Billion$31.9 Billion$37.0 Billion (AI Run-Rate)
Alphabet (Google)$180.0 – $190.0 Billion$35.7 Billion$80.0 Billion (Cloud Total)
Meta Platforms$125.0 – $145.0 Billion$7.5 – $9.5 Billion (Estimated)Minimal Direct AI Revenue Monetization

The data reveals that the investment ecosystem is scaling nearly 50% faster than corresponding organic software sales, which aggressively stretches out corporate payback periods. This balance sheet stress is fundamentally exacerbated by escalating utility bottlenecks. Data center construction requires substantial increases in electricity consumption, yet global energy grid capacity remains inelastic due to regulatory delays and aging infrastructure. As hyperscalers compete for limited gigawatt allocations and nuclear supply agreements, the baseline operational costs of maintaining these advanced clusters are rising significantly faster than originally modeled, compressing long-term return assumptions.

Macroeconomic Theory: An Austrian Capital Cycle Perspective

From a macroeconomic theory framework, this rapid shift closely mirrors an Austrian business cycle model of capital distortion. When capital is artificially concentrated into a singular technological frontier due to competitive pressures and corporate FOMO, it frequently induces a severe intertemporal mismatch. Hyperscalers have aggressively over-allocated resources toward long-duration, highly specialized fixed assets—specifically high-performance clusters and custom silicon—under the assumption that consumer-level software demand would instantly justify the expenditure.

Instead, the market is experiencing a classic “malinvestment” correction. The physical capital has been sunk into production processes that are currently too far removed from genuine consumer utility. Because software monetization cycles require gradual, organic enterprise implementation rather than sudden systemic upgrades, tech companies are finding that their expensive infrastructure investments are sitting underutilized. The recent equity corrections simply reflect the market adjusting asset valuations down to match the true, slower timeline of real consumer savings and demand.

Historical Parallels: Echoes of the Late 1990s Dot-Com Era

This sudden shift in market psychology heavily mirrors the macroeconomic lifecycle of the late 1990s technology bubble. During the buildup to the 2000 market peak, an identical structural narrative emerged: the commercialization of the internet triggered an unprecedented surge in capital expenditure toward telecom infrastructure, fiber-optic networking, and early server systems. Investors aggressively bid up equipment providers under the assumption that build-out velocity would directly dictate long-term market dominance.

The eventual implosion of the dot-com bubble was not caused by a failure of the technology itself—as the internet did ultimately transform global commerce—but rather by a systemic mismatch in corporate cash-flow timing. Just as today’s analysts question the near-term return on investment for multi-billion-dollar AI clusters, the 1990s bull market collapsed when companies realized that the consumer and enterprise adoption curve for internet software could not immediate satisfy the debt-laden capital expenditures of the physical infrastructure build-out.

From a broader macroeconomic perspective, this transition represents a classic consolidation phase often observed during major technological revolutions. The current market anxiety does not necessarily signal the end of artificial intelligence as a secular growth driver, but rather a structural rebalancing. The initial infrastructure build-out phase is nearing maturity, and the market is now demanding proof of economic utility. Moving forward, the sustainability of these high valuations will depend on the broader corporate sector’s capacity to integrate these technologies into revenue-generating business models, shifting the economic focus from speculative asset appreciation to measurable productivity gains.


Market analysis provided by The Macro Compass is for informational purposes only. Please consult with a financial advisor before making investment decisions.

The Great Uncoupling: What the UAE’s OPEC Exit Means for Your Energy Future

The global oil landscape shifted on May 1, 2026, as the United Arab Emirates officially ended its 59-year membership in OPEC. This “shock” move, coming in the middle of a major regional energy crisis, effectively transforms the UAE into an oil “free agent”.

Why the UAE Walked Away

The decision follows years of internal tension between Abu Dhabi and the Saudi-led cartel over production limits.

  • Production Handcuffs: The UAE has spent $150 billion to expand its oil capacity to nearly 5 million barrels per day (bpd). Under OPEC, it was restricted to roughly 3.5 million bpd, leaving billions in potential revenue on the table.
  • National Interest First: UAE Energy Minister Suhail al-Mazrouei clarified this was a strategic policy shift to maximize domestic wealth and fund the nation’s transition into non-oil sectors like AI and green energy.
  • Regional Discord: Tensions with Saudi Arabia over regional leadership and the ongoing conflict in the Gulf made the strictures of the alliance increasingly untenable for Emirati leadership.

Impact on Global Supplies

While the UAE is now free to pump at will, the physical supply of oil hasn’t changed overnight.

  • The Hormuz Bottleneck: The ongoing blockade of the Strait of Hormuz means that much of the UAE’s oil remains physically stranded. Until maritime traffic fully resumes, the country cannot yet flood the market with its extra capacity.
  • Future Surge: Experts at BBC News suggest that once logistical hurdles clear, the UAE could increase global production by one million barrels per day almost immediately.

What This Means for Oil Prices

The departure of OPEC’s third-largest producer has created two distinct market phases:

  1. Short-Term Volatility: Markets initially dipped on “supply-glut” fears before rebounding to over $112 Brent and $105 WTI due to the high “war premium” currently priced into every barrel.
  2. Long-Term Bearish Outlook: Analysts at CNN Business and Yahoo Finance note that by stripping OPEC of its primary source of spare capacity, the cartel’s ability to “floor” prices is permanently weakened. This could lead to significantly lower prices once regional stability returns.

The Market in General: Winners and Losers

The exit is a blow to the cartel’s cohesion but a potential boon for Western markets.

  • U.S. Relations: Experts believe the U.S. government welcomes the move as it curbs the cartel’s overall pricing power.
  • Stock Market Shift: According to MarketWatch, the move creates clear winners in U.S. energy stocks, while industries like airlines and logistics may face continued margin pressure until regional shipping stabilizes.

Market analysis provided by The Macro Compass is for informational purposes only. Please consult with a financial advisor before making investment decisions.

Operation “Project Freedom”: Naval Escorts in the Strait of Hormuz

The global energy market is currently at a high-stakes crossroads. On May 4, 2026, the U.S. will officially launch Project Freedom, a major initiative to provide military escorts for commercial vessels through the Strait of Hormuz. This move, announced by President Donald Trump, aims to break a weeks-long maritime gridlock that has paralyzed one of the world’s most critical energy chokepoints.

The Current Crisis in the Strait

The Strait of Hormuz, a narrow waterway south of Iran, typically handles roughly 20% of the world’s oil and liquefied natural gas (LNG). Since the outbreak of conflict in February 2026, passage has become a high-risk gamble:

  • Widespread Blockades: Iranian-laid sea mines and threats of drone or missile strikes have effectively closed the channel to most neutral commercial traffic.
  • Stranded Cargo: Approximately 230 oil tankers and numerous LNG carriers are currently idle in the Persian Gulf, unable to deliver their vital loads to global markets.
  • Insurance Shocks: Tanker insurance rates skyrocketed to over 10 times their normal levels, making passage economically unfeasible for most shipping lines.

How Escorts Affect Oil Prices

Markets have historically reacted sharply to news regarding the Strait, and Project Freedom is already shifting the narrative.

  • Stabilizing the Supply: By guiding stranded tankers out of the Gulf, the U.S. Navy aims to inject millions of barrels of crude back into the global supply chain. Initial reactions saw Brent crude dip toward $106 per barrel following the announcement, down from peaks of over $120.
  • Lowering Risk Premiums: The U.S. is also offering affordable political risk insurance through the Development Finance Corporation to encourage shipping lines to resume transits.
  • Inflationary Pressures: Despite the escorts, prices remain roughly 50% above pre-conflict levels. Experts at U.S. News & World Report note that every $10 increase in crude can raise American gas prices by 25 cents, contributing to wider inflationary concerns.

Broader Market Impacts

The ripples of the Hormuz crisis extend far beyond the fuel pump:

  • Shipping & Logistics: The backlog of ships has caused extreme spikes in overall shipping costs, affecting the price of global goods.
  • Agriculture: Disruption to fertilizer production—specifically nitrogen and phosphorus—threatens global food security, as rising costs may lead farmers to reduce usage.
  • Asian Markets: Countries like China, India, Japan, and South Korea are the most vulnerable, as they historically receive over 80% of the oil transiting the Strait.

While the U.S. Navy‘s presence provides a tactical solution, the long-term health of the market depends on whether this move leads to a broader de-escalation or a further hardening of regional conflict.


Market analysis provided by The Macro Compass is for informational purposes only. Please consult with a financial advisor before making investment decisions.

The 100% Milestone: Navigating the Era of Triple-Digit Debt

In March 2026, the United States crossed a psychological and economic Rubicon: the national debt officially exceeded 100% of the country’s Gross Domestic Product (GDP). While $31 trillion is a number so large it loses meaning, the 1:1 ratio is impossible to ignore. It means that for every dollar of value Americans produce in a year, the federal government owes a dollar to creditors.

This isn’t just a ledger entry; it’s a fundamental shift in the American economic story.

Why the 100% Ratio Matters

The debt-to-GDP ratio is often called the “credit score” of a nation. At 100%, the U.S. has entered a “danger zone” that economists have debated for decades.

  • The Tipping Point: Research from institutions like the Mercatus Center suggests that for advanced economies, debt becomes a “drag” on growth once it crosses roughly 75-80%. Every percentage point above this threshold is estimated to shave approximately 3.3 basis points off annual economic growth.
  • Fiscal Space: When a government is already maxed out, its “fiscal space”—the ability to borrow and spend during emergencies like pandemics or recessions—is severely limited.
  • The Interest Trap: As of 2026, interest payments on the debt have ballooned to over $1 trillion annually. For the first time in modern history, we are spending nearly as much on interest as we do on national defense.

Historical Context: From WWII to Today

The only other time the U.S. debt-to-GDP ratio reached these heights was in 1946, immediately following World War II, when it peaked at 106%. However, the “Great Drawdown” of the 1950s was driven by a post-war manufacturing boom and a younger population.

Today’s climb is structural, not temporary. It is driven by an aging population, rising healthcare costs, and a persistent gap where spending averages 21% of GDP while revenue stays at 18%.

How This Affects the Markets

Investors should prepare for a “new normal” where fiscal health dictates market volatility.

  1. “Crowding Out” Effect: When the government borrows trillions, it competes with the private sector for capital. This “crowding out” can lead to higher long-term interest rates, making it more expensive for businesses to expand and for consumers to get mortgages.
  2. Bond Market Jitters: We are seeing increased sensitivity in the Treasury market. If investors begin to doubt the U.S. government’s ability to service this debt without resorting to inflation (printing money), they will demand higher yields, leading to further price drops in existing bonds.
  3. The Growth Ceiling: High debt levels correlate with slower GDP growth. For equity markets, this could mean a lower “ceiling” for corporate earnings over the next decade.

The Bottom Line

Crossing 100% isn’t a guaranteed collapse—countries like Japan have operated at over 200% for years due to strong institutional trust. However, for the U.S., it marks the end of “consequence-free” borrowing.

As the Congressional Budget Office projects the ratio to hit 120% by 2036, the conversation must shift from “if” we should address the deficit to “how” drastically we must rebalance.


Market analysis provided by The Macro Compass is for informational purposes only. Please consult with a financial advisor before making investment decisions.

End of an Era: Markets Brace for Powell’s Final Act Amid Inflation Storm

The financial world is fixated on Washington this week for the Federal Reserve’s April 28–29 policy meeting. While the headline rate decision is almost certain to be a “no-change” at 3.50%–3.75%, the subtext is anything but quiet.

Between the energy price shocks from the Middle East conflict and a looming leadership change from Jerome Powell to Kevin Warsh, investors are navigating a “perfect storm”. Recent data showing inflation surging to 3.3% has effectively erased hope for near-term relief, forcing Wall Street to accept that rates will likely stay “higher for longer”.

For markets, the real volatility won’t come from the 2:00 PM statement, but from Powell’s final press conference. Will he use his swan song to cement a hawkish legacy against rising prices, or will he maintain a neutral stance to hand over a stable economy to his successor? One thing is certain: with a 100% market consensus for a pause, any deviation in tone will cause immediate ripples across the S&P 500 and the U.S. dollar.


The Federal Open Market Committee (FOMC) is widely expected to keep interest rates unchanged at its April 29, 2026, meeting, maintaining the federal funds target range at 3.50%–3.75%. Market sentiment has shifted significantly due to rising inflation and geopolitical uncertainty, with traders now pricing in a nearly 100% probability of a third consecutive pause.

FOMC Meeting Forecast: April 29, 2026

  • Rate Decision: A “virtual lock” to hold rates steady.
  • Inflation Pressures: Consumer Price Index (CPI) inflation jumped to 3.3% in March from 2.4% in February, driven largely by skyrocketing energy costs related to the ongoing war in Iran.
  • Leadership Transition: This is likely to be Jerome Powell’s final meeting as Chair before his term expires on May 15. Kevin Warsh is expected to be his successor.
  • Forward Guidance: Experts anticipate the Fed will adopt a “wait-and-see” approach, with some officials potentially signaling a hawkish pivot (discussing future rate hikes) if inflation remains unanchored.

Market Impact Analysis

  • Equities: Stocks have recently shown vulnerability due to the removal of anticipated rate cuts from the 2026 outlook. A hawkish tone from Powell could further pressure high-growth sectors like AI infrastructure.
  • Fixed Income: Markets are now pricing in a “prolonged holding pattern,” with CME’s FedWatch tool showing zero expectation of a cut this month.
  • Currencies: The U.S. Dollar Index (DXY) is currently testing key technical levels near its 200-day moving average; a focus on inflation risks during the press conference could trigger a hawkish rally.

Market analysis provided by The Macro Compass is for informational purposes only. Geopolitical events are highly volatile; please consult with a financial advisor before making investment decisions based on conflict-related data.

The UAE’s OPEC Exit: A High-Stakes Break for Strategic Autonomy

On April 28, 2026, the United Arab Emirates (UAE) delivered a historic blow to the global energy landscape by announcing its withdrawal from both OPEC and the wider OPEC+ alliance, effective May 1, 2026. This decision marks the end of a nearly 60-year membership and signals a fundamental shift in how one of the world’s most influential oil producers intends to manage its resources.

The move comes amid intense regional instability, including the ongoing U.S.-Israel war with Iran, which has severely restricted oil exports through the Strait of Hormuz.

Why the UAE is Leaving Now

The UAE Energy Ministry characterized the exit as a strategic “evolution” of its sector policies to enhance flexibility. Key drivers include:

  • Production Freedom: As OPEC’s third-largest producer, the UAE has long felt constrained by production quotas. By leaving, it can now move toward its goal of increasing production capacity to 5 million barrels per day (bpd) by 2027—and potentially up to 6 million bpd—without external limits.
  • National Interest Over Collective Restraint: Officials stated the need to prioritize national strategic and economic visions. This includes maximizing the value of its oil reserves before global demand potentially peaks in the coming decade.
  • Geopolitical Friction: The decision reflects a growing rift with Saudi Arabia, OPEC’s de facto leader, and frustration with fellow Arab states regarding regional security responses during the recent Middle East conflict.

The Impact on Global Markets

While the immediate reaction in oil markets has been somewhat muted due to existing supply constraints in the Strait of Hormuz, the long-term implications are profound.

  • Weakened Cartel Influence: The departure removes roughly 13–15% of OPEC’s production capacity, significantly diminishing the group’s ability to calibrate global supply and stabilize prices.
  • Potential for Lower Prices: In the long term, once export routes normalize, the UAE’s ability to pump oil “unconstrained” could put downward pressure on global crude prices.
  • Opportunities for U.S. Partners: Analysts at Yahoo Finance and The Motley Fool suggest that U.S. companies like ExxonMobil and Occidental Petroleum, which have significant joint ventures with the UAE’s national oil company (ADNOC), may benefit from increased production opportunities.

The End of an Era?

The UAE follows other recent departures, such as Qatar (2019) and Angola (2024), leading some experts to call this “the beginning of the end” for OPEC’s decades-long dominance. By prioritizing sovereign flexibility and strategic autonomy, the UAE is redrawing the global oil power lines for a more competitive—and potentially more volatile—energy future.


Market analysis provided by The Macro Compass is for informational purposes only. Geopolitical events are highly volatile; please consult with a financial advisor before making investment decisions based on conflict-related data.

Diplomatic Deadlock: How Trump’s Scrapped Pakistan Talks Could Shake the Markets Next Week

The high-stakes diplomatic gamble in Islamabad has hit a wall. On Saturday, President Trump abruptly canceled the peace talks between U.S. and Iranian officials in Pakistan, citing “tremendous infighting and confusion” within the Iranian leadership.

While the President insists this isn’t an immediate return to war, the global markets—which hate nothing more than uncertainty—are bracing for a turbulent Monday morning. Here is what investors and analysts are watching as we head into the new trading week.

1. Energy Markets: The Squeeze Continues

The most immediate impact will be felt at the pump and on the energy exchanges. With the Strait of Hormuz remaining closed and a second U.S. aircraft carrier joining the naval blockade, the failed breakthrough in Pakistan leaves no clear exit ramp for the current supply crisis. Crude oil prices, already under immense pressure, are expected to remain elevated or spike further as the “diplomatic premium” fades.

2. A “Risk-Off” Monday?

Early indicators suggest a bumpy ride for equities. The Invesco QQQ Trust (QQQ) showed downward movement in after-hours trading immediately following the announcement. As the hope for a “permanent deal” cools, we expect a classic “risk-off” rotation:

  • Safe Havens: Look for potential movement toward gold, Treasuries, and the U.S. dollar as investors seek shelter from geopolitical volatility.
  • Tech and Growth: These sectors may face headwinds if inflationary fears regarding energy costs continue to rise.

3. The Inflation Shadow

Perhaps the most concerning takeaway for the broader economy is the threat of “hyperinflation.” Analysts warn that the longer these critical trade routes remain blocked and diplomatic channels stay silent, the more likely we are to see a sustained rise in the cost of goods globally.

The Bottom Line

The departure of Iranian Foreign Minister Abbas Araghchi from Islamabad without a deal has effectively hit the “pause” button on regional stability. While the U.S. administration maintains a posture of high-readiness rather than active conflict, the market’s reaction will likely be one of caution.

Expect volatility to be the theme of the week. Investors should keep a close eye on real-time energy updates and any further messaging from the White House regarding the status of the naval blockade.


Market analysis provided by The Macro Compass is for informational purposes only. Geopolitical events are highly volatile; please consult with a financial advisor before making investment decisions based on conflict-related data.

The 2026 Resilience Report: Navigating the Middle East Crisis and the “Safe-Haven” Paradox

As March 2026 concludes, escalating military tensions and the closure of the Strait of Hormuz are triggering an economic crisis with surging oil prices and rising inflation in essential goods. Investors are urged to hedge with metals and consider energy stocks due to an extreme Gold-to-Oil ratio, while a strengthening dollar influences gold prices.

As we enter the final week of March 2026, the global economy is facing a perfect storm. With “Operation Epic Fury” escalating and up to 10,000 additional U.S. troops headed to the Middle East, the Strait of Hormuz remains a volatile chokepoint that is effectively redrawing the map for American investors.

For the readers of The Macro Compass, the primary question isn’t just “What is happening?” but “How do I protect my capital?” Here is your strategic navigational chart for the week ahead.


The Energy Shock: Beyond the Gas Pump

The closure of the Strait is no longer a regional headline—it is a systemic shock to the cost of living. With 20% of global oil and 25% of liquefied natural gas (LNG) currently trapped, Brent crude has surged past $112 a barrel.

  • The Inflationary Tsunami: At the recent CERAWeek conference in Houston, oil CEOs like Chevron’s Mike Wirth and Aramco’s Amin Nasser warned that we are underestimating the “physical manifestations” of this closure.
  • The Hidden Hit: It’s not just fuel. The region is a titan in the fertilizer market. With supply lines cut, global farming costs have jumped 38%, a move that guarantees double-digit food inflation through the next harvest cycle.

The Safe-Haven Paradox: Are Metals Still the Answer?

When the drums of war beat louder, the traditional playbook says “buy gold.” But in 2026, that playbook is being rewritten by a surging U.S. Dollar.

  • Gold ($4,524/oz): Gold remains the ultimate “portfolio insurance,” but we are seeing a sharp pullback from January’s highs of $5,600. This isn’t a lack of faith; it’s a scramble for liquidity.
  • Silver ($94/oz): Caught in a “dual identity” crisis, silver is both a monetary hedge and a critical component in the AI and 5G revolutions. Despite recent volatility, the structural supply deficit makes it a strong long-term play.
  • Base Metals: If you want to know where consumer prices are headed, watch Copper and Aluminum. Both have surged as international buyers pay record premiums to secure supply.

Strategic Rotation: The Gold-to-Oil Ratio

The Macro Compass is currently tracking a historic anomaly. The Gold-to-Oil Ratio—the number of barrels of oil an ounce of gold can buy—is sitting at a staggering 40:1.

Historically, this ratio hovers around 15 to 20. A ratio this high suggests that while gold has done its job as a hedge, energy equities (XLE) are now significantly “cheaper” relative to bullion than they have been in decades. We are transitioning from a “buy everything” metals phase to a selective accumulation phase where energy stocks may offer better value.


The Bottom Line: A “Risk-Off” Reality

President Trump has characterized the military buildup as leverage for a peace deal, but the markets are pricing in a prolonged conflict. Expect continued volatility in the S&P 500, which has already shed over 4% this month.

The Macro Compass Strategy:

  1. Hedge with Metals: Maintain a 5%–10% “insurance” allocation in physical gold or silver.
  2. Rotate into Energy: Look for entries in diversified energy producers while the Gold-to-Oil ratio remains at extremes.
  3. Watch the Dollar: A strengthening USD will act as a “ceiling” for gold prices in the short term.

Market analysis provided by The Macro Compass is for informational purposes only. Geopolitical events are highly volatile; please consult with a financial advisor before making investment decisions based on conflict-related data.

“Economic Terrorism”: Energy Titans Warn of a Long-Term Crisis at the Strait of Hormuz

Energy executives at CERAWeek warned that the global economy is underestimating the blockade at the Strait of Hormuz, leading to a severe supply crisis. With 20% of global oil stranded and systemic inflation rising, the impact on prices for consumers will be significant. The situation is expected to disrupt the economy for months.

The world’s most powerful energy executives gathered this week at the CERAWeek conference in Houston, and their message was blunt: the global economy is drastically underestimating the severity of the blockade at the Strait of Hormuz. What started as a regional military standoff has evolved into what ADNOC CEO Sultan Al Jaber calls “economic terrorism against every nation.”

As “Operation Epic Fury” enters its second month, here is the reality check from the men and women who run the world’s oil and gas supply.

The “Nightmare Scenario” for Supply

For weeks, the market hoped for a quick resolution. The CEOs have officially ended that optimism. Chevron CEO Mike Wirth warned that investors are trading on “scant information” and have not yet felt the “physical manifestations” of the closure.

The logistical math is grim:

  • Stranded Assets: Roughly 20% of global oil and 25% of liquefied natural gas (LNG) are currently trapped behind the blockade.
  • The “Help!” Calls: Cheniere Energy CEO Jack Fusco revealed he is receiving desperate calls from Asian buyers as the final pre-war shipments of Qatari gas make landfall. Once those are gone, the “dry spell” begins.
  • Infrastructure Damage: Saudi Aramco’s Amin Nasser confirmed that missile and drone attacks have caused “catastrophic” damage to regional infrastructure, meaning supply won’t just “flicker back on” even if the Strait opens tomorrow.

The Inflationary Tsunami: What This Means for Your Wallet

The primary concern for consumers is no longer just the price of a gallon of gas; it’s the systemic inflation triggered by a $112+ barrel of oil.

  1. “Cost-Push” Inflation: When energy costs spike, the cost of manufacturing and transporting everything follows. We are seeing a “cascading effect” where prices for groceries, plastics, and electronics are adjusted upward weekly to account for surging freight and power costs.
  2. The Fertilizer Crisis: Shell CEO Wael Sawan noted that the shock is moving West. Because the Middle East is a hub for fertilizer production, the blockade is driving up farming costs globally, guaranteeing double-digit food inflation through the next harvest cycle.
  3. The Fed’s Corner: With energy-driven inflation soaring, the Federal Reserve faces a “Stagflation” trap—forced to keep interest rates high to battle rising prices even as the military conflict threatens to slow down global economic growth.

Market Reaction: A “Risk-Off” Reality

The CEOs’ warnings have sent a chill through Wall Street. ExxonMobil CEO Darren Woods noted that the company has already evacuated non-essential staff from the region, a move mirrored by many multinationals.

Investors are pivoting away from high-growth tech stocks and toward “defensive” plays:

  • Winners: Large-cap Energy (XLE) and Defense contractors remain the only green spots on the board.
  • Losers: Airlines and Retailers are being hammered by the dual threat of high fuel surcharges and cooling consumer demand.

The Bottom Line: The “Leverage” strategy of deploying 10,000 more troops is being watched closely, but the energy industry is already bracing for a multi-month disruption. As Kuwait Petroleum’s CEO put it, the global economy is currently being “held hostage,” and the ransom is being paid by every consumer at the checkout counter.


Market analysis provided by The Macro Compass is for informational purposes only. Geopolitical events are highly volatile; please consult with a financial advisor before making investment decisions based on conflict-related data.