PCE Preview: Will May’s Inflation Print Seal the Deal on a Fed Hike?

Wednesday, June 24, 2026

Tomorrow morning at 8:30 a.m. EDT, the Bureau of Economic Analysis drops the May Personal Consumption Expenditures (PCE) report — the Federal Reserve’s preferred inflation gauge and markets are on edge. With a hawkish new Fed chair, a Middle East conflict still casting a shadow over energy prices, and rate-hike odds climbing by the day, this print could be the most consequential inflation release of the year.


What Economists Are Expecting

Wall Street is bracing for a hot number. The consensus, per FactSet, calls for:

  • Headline PCE: +0.5% month-over-month (up from +0.4% in April), rising to 4.1% year-over-year (from 3.8% in April)
  • Core PCE (ex-food & energy): +0.37% month-over-month (up from +0.24% in April), holding at 3.3% year-over-year

Bank of America, Goldman Sachs, and UBS are all clustered around these figures, which they note largely reflect what was already telegraphed by the May CPI and PPI data. UBS is projecting headline PCE at 4.10% YoY with core at 3.45%.

The driver is no mystery: energy. West Texas Intermediate crude surged from roughly $57/barrel at the start of 2026 to a peak of $113/barrel in April, driven by the conflict in Iran and the closure of the Strait of Hormuz. While oil prices have pulled back to around $74-76/barrel more recently, the May data captures a period of still-elevated fuel costs and that flows directly into headline PCE.


The Bigger Picture: A Fed at an Inflection Point

This report lands one week after Fed Chair Kevin Warsh’s first FOMC meeting, which markets widely interpreted as a hawkish turn. The June dot plot showed nine of eighteen officials penciling in at least one rate hike before year-end, erasing the prior expectation of a cut. The Fed’s median projection for year-end PCE inflation was revised up sharply to 3.6% for headline and 3.3% for core — both well above the 2% target.

The funds rate currently sits at 3.5%–3.75%, where it has been since late 2025 cuts. After Warsh’s press conference, CME FedWatch odds of at least one hike by year-end jumped dramatically, with traders now eyeing a move as early as October.

A hot PCE print tomorrow would pour fuel on those expectations.


The Iran War: The Inflation Variable No Model Fully Captures

Research from the Dallas Fed shows that the Strait of Hormuz closure has added meaningful upside to PCE inflation in 2026, with estimates of an additional 0.40–1.25 percentage points to Q4/Q4 headline PCE depending on the duration of the disruption. Core PCE has been less directly affected. But the longer supply chains remain stressed, the more the shock bleeds into broader prices.

There is, however, a potential silver lining: reports emerged this past weekend of a US-Iran peace agreement, and markets have already begun to price in some relief. Gasoline prices are down roughly $0.56/gallon from their May 20th peak, which should cool June’s headline PCE meaningfully. UBS and others expect May to mark the peak for headline PCE inflation this year.


What Would Move Markets

Hotter than expected (>4.2% YoY headline, >3.4% core YoY): Expect a further rise in short-term Treasury yields, dollar strength, and pressure on equities — especially rate-sensitive sectors like tech and real estate. Rate-hike odds for October and December would spike.

In-line with consensus (~4.1% headline, ~3.3% core): A measured reaction. Markets may view it as “bad but known.” The hike narrative stays intact but doesn’t accelerate.

Cooler than expected (<3.9% headline, <3.1% core): A relief rally in equities, some bond buying, and a modest repricing of hike odds. The Fed would still face pressure to tighten eventually, but the urgency fades.


The Fed’s Dilemma in Plain Terms

Warsh’s Fed inherited an economy with a resilient labor market — nonfarm payrolls added 172,000 jobs in May, with unemployment steady at 4.3% — but with inflation running far above target. Professional forecasters surveyed by the Philadelphia Fed put Q4/Q4 headline CPI inflation at 3.5% for 2026. Core PCE YoY has climbed from 3.0% in December 2025 to 3.3% in April 2026.

As Bank of America put it: “Overall, this would be a good number for the Fed, but it’s hard to take too much signal, given the uncertainty tariffs pose around the inflation path.” Add in the Iran war premium, and the Fed is navigating a fog of supply-side shocks that monetary policy alone can’t cure.


Bottom Line

Tomorrow’s PCE is not just an inflation reading — it’s a referendum on whether the Fed has more work to do. With the dot plot already pointing toward hikes, a print near consensus keeps the October hike in play. A beat to the upside could accelerate that timeline and rattle equity markets heading into the back half of the year.


Market analysis provided by The Macro Compass is for informational purposes only. Please consult with a financial advisor before making investment decisions.
Chance of a Recession this Year

Short answer: Markets & big forecasters put the U.S. recession probability for the rest of 2025 roughly in the 30–40% range today, but estimates vary from the low-teens up to the 50–60% area depending on the model and timing of the call.

Here’s a quick, sourced read on why that range is so wide and what could push it higher or lower.

Why forecasters disagree

  • Different models & inputs. Some groups (Goldman, JPMorgan, IMF, private forecasters) weight trade/tariffs, payroll revisions, inflation, and financial-market signals differently — producing Goldman ≈30%, JPMorgan ≈40% (recent update), and IMF/others ~40% estimates. (fi-desk.com)
  • Timing matters. A model that asks “recession in next 6 months?” gives different odds than “recession this calendar year.”
  • Fast-changing data. Big downward payroll revisions, sticky core inflation prints, or new tariff moves rapidly change the odds (markets reprice in days).

Key drivers that raise recession odds

  • Major, persistent labor weakness (continued big payroll downgrades or rising unemployment).
  • A sharp earnings and hiring pullback that feeds into consumer spending declines.
  • Policy confusion — sticky inflation plus weak growth could force the Fed into a painful tradeoff (no cut = growth hit; cut = inflation re-acceleration).
  • Escalating trade or geopolitical shocks that damage exports/supply chains. (Federal Reserve)

Key drivers that lower odds

  • Inflation falling more clearly (PPI/CPI/PCE easing), giving the Fed room for orderly cuts and supporting demand.
  • Resilient corporate capex, especially AI-related investment, keeping jobs and earnings supported.
  • Trade de-escalation or fiscal support that offsets private weakness. (IMF)

Market implications if odds rise vs fall

  • Odds rise (recession more likely): bonds rally (yields ↓), gold and safe havens ↑, cyclical equities and financials underperform, tech/quality may initially rally on rate cuts but could fall if earnings deteriorate.
  • Odds fall (soft landing more likely): equities rally broadly (tech + cyclicals), yield curve may steepen moderately, USD softens.

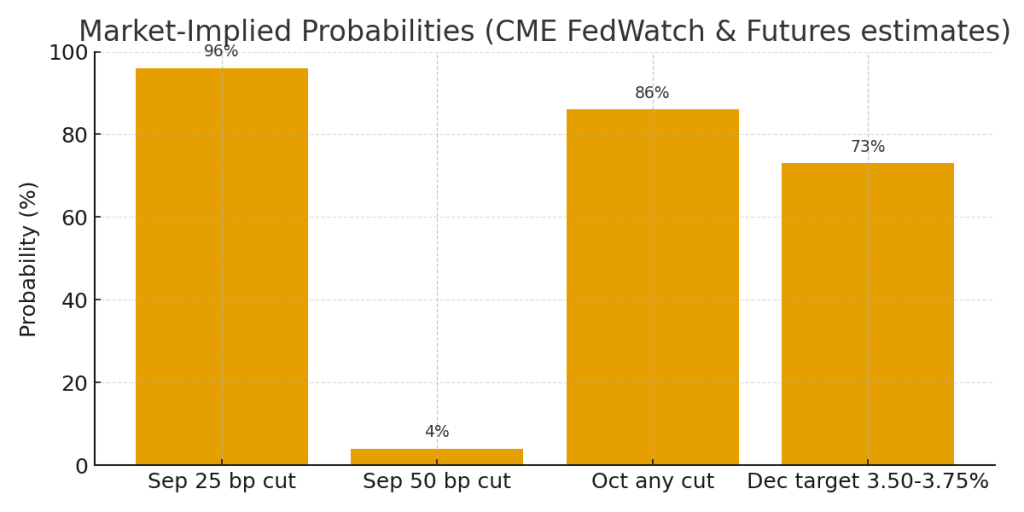
1) Market-implied probabilities (what markets are pricing now)

  • September 2025 meeting (next FOMC)
    • ~95–96% probability of a 25 bps cut (i.e., markets expect a quarter-point cut). (CME Group)
  • October 2025 meeting
    • Odds for another cut in October have jumped — Reuters notes futures lifted chances for easing in October to ~86% after the September cut. (Reuters)
  • Total easing priced for 2025 (by year-end)
    • Markets are pricing roughly ~60–80 bps of cuts in total for 2025 (i.e., 2–3 quarter-point cuts including the one in September). Many futures-based trackers and analysts converge around ~70 bps of cuts priced in for the remainder of the year. (Reuters)
  • Probability of a “jumbo” 50 bps cut in September
    • Still low but non-zero — generally ~5–10% depending on the source. Statista / CME snapshots and news pieces put this in single digits. (Statista)
  • Recession probability context
    • Major banks’ published recession probabilities are clustered in the ~30–40% range for a U.S. recession within the next 12 months, though models vary. (Markets and some houses earlier priced higher and then trimmed odds as data evolved). (JPMorgan Chase)

2) Two scenario models and the expected market reactions

I’ll show each scenario, how likely markets currently think it is, the immediate asset reactions, sector winners/losers, and suggested portfolio tilts and risk controls.


Scenario A — Soft Landing (base / market-priced)

Probability (market-implied): ~50–65% (markets are leaning toward this via FedWatch + futures pricing). (CME Group)

Description: Fed cuts ~25 bps in Sept and another 25 bps later in 2025; inflation drifts lower, jobs stabilize (no large spike in unemployment), growth slows but remains positive.

Immediate asset moves (days → weeks):

  • Stocks: Mild-to-moderate rally; tech, growth, REITs and small caps outperformance.
  • Bonds: Short-term yields fall (2-yr down), long yields drift down less → yield curve steepens modestly.
  • Dollar: Modestly weaker.
  • Gold: Rises modestly.
  • Commodities/Oil: Mixed; oil steadies on demand hopes.

Sector winners / losers

  • Winners: Tech/AI/semi equipment, housing/REITs, consumer discretionary, small caps.
  • Losers/underperformers: Short-duration financials (some margin compression), defensives (utilities/staples) may lag.

Portfolio tilt (example, tactical 3-month):

  • Equities: +5–10% overweight growth/tech & select cyclical exposure.
  • Bonds: +5–10% overweight high-quality duration (2–7 year Treasuries).
  • Cash: Trim — 5% buffer to buy dips.
  • Gold: +2–4% as insurance.

Risk management:

  • Keep stops or hedges on concentrated tech positions (market is sensitive to guidance).
  • Ladder Treasuries (reduce reinvestment shock).

Scenario B — Hard Landing / Recession Risk

Probability (market-implied tail risk): ~20–35% (markets price a nontrivial chance; some forecasters place odds higher ~30–40%). (JPMorgan Chase)

Description: Despite cuts (25–50 bps total), payroll revisions/ongoing weakness push unemployment higher, corporate earnings degrade. Cuts are seen as reactive, not preventive → growth contracts.

Immediate asset moves:

  • Stocks: Short-term rally on initial dovish surprise may give way to a broader equity selloff as earnings forecasts get cut. Cyclicals and small caps hit hardest.
  • Bonds: Strong rally (yields fall across curve), 2-yr falls sharply as Fed cuts are front-loaded.
  • Dollar: Initially weak on cuts, but can become volatile — in a global risk-off the USD can strengthen as a safe haven.
  • Gold: Strong safe-haven demand → substantial gains.
  • Commodities/Oil: Fall on demand worries.

Sector winners / losers

  • Winners: High-quality long duration bonds, gold, consumer staples/defensive healthcare, select utilities.
  • Losers: Banks (credit cycle & NIM pressure), capital goods, industrial cyclical names, energy (lower demand).

Portfolio tilt (defensive 3-month):

  • Equities: Reduce exposure; shift toward quality dividend payers + defensives. (e.g., 30–40% equity allocation instead of 60% baseline).
  • Bonds: Increase allocation to high-quality Treasuries and investment-grade corporates; overweight duration (2–10y).
  • Cash / Liquidity: Step up to 10–15% for optionality.
  • Gold: Increase to 5–8% as hedge.
  • Alternative hedges: Consider small allocation to tail-risk hedges (protective puts, managed futures).

Risk management:

  • Trim levered / highly cyclical exposures quickly on signs of earnings downgrades.
  • Monitor credit spreads (if spreads widen, reduce credit risk).

Practical what to watch next (data & market signals that should change odds)

  • Weekly jobless claims & next payrolls — if claims rise and payrolls remain weak, Hard Landing odds increase.
  • Core CPI / PCE prints — sticky inflation reduces the Fed’s ability to cut more, lowering Soft Landing odds.
  • Fed communications & dots — if dot plot keeps signaling cuts, markets price them in; hawkish tone can reverse expectations fast. (Reuters)
  • Credit spreads & high-yield performance — early warning of stress; widening spreads point to higher recession risk.
  • Equity breadth and earnings revisions — broad downgrades imply growth risk.

Quick action checklist (if you manage money)

  1. Re-check position size in tech/growth — they’re most sensitive to a Fed policy surprise.
  2. Ladder into longer-duration Treasuries or a short-duration bond ladder if you want yield + safety.
  3. Keep cash buffer (5–15%) to buy quality on weakness.
  4. Use stop loss or protective options for concentrated bets — a small premium buys big asymmetric protection.
  5. Track the five key data points weekly (jobs, CPI/PCE, claims, credit spreads, Fed speak).

Sources and evidence (most important market-facing references)

  • CME FedWatch (market-implied probabilities for Fed moves). (CME Group)
  • Reuters reporting on futures boosting the odds of further easing after the Sept cut. (Reuters)
  • CBS / Statista snapshots summarizing cut probabilities (95–96% for Sept 25 bps). (CBS News)
  • J.P. Morgan analysis on recession probability shifts. (JPMorgan Chase)
  • CME rates recap showing elevated futures positioning and activity. (CME Group)