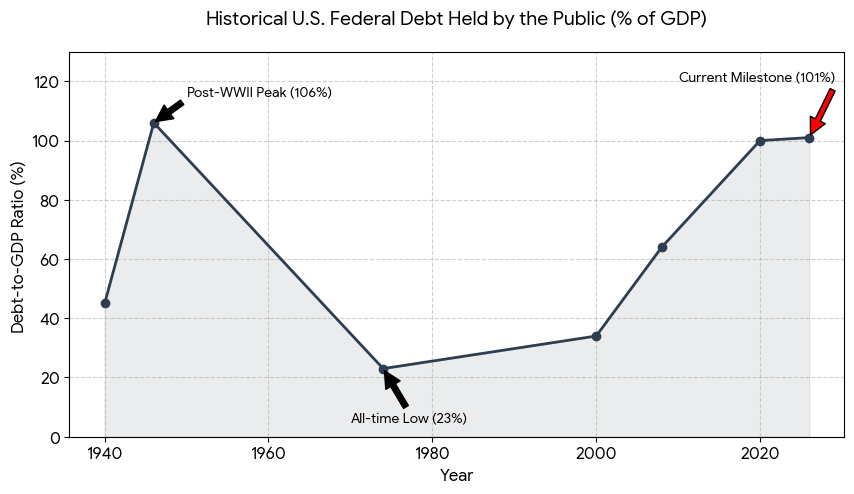
In March 2026, the United States crossed a psychological and economic Rubicon: the national debt officially exceeded 100% of the country’s Gross Domestic Product (GDP). While $31 trillion is a number so large it loses meaning, the 1:1 ratio is impossible to ignore. It means that for every dollar of value Americans produce in a year, the federal government owes a dollar to creditors.
This isn’t just a ledger entry; it’s a fundamental shift in the American economic story.
Why the 100% Ratio Matters
The debt-to-GDP ratio is often called the “credit score” of a nation. At 100%, the U.S. has entered a “danger zone” that economists have debated for decades.
- The Tipping Point: Research from institutions like the Mercatus Center suggests that for advanced economies, debt becomes a “drag” on growth once it crosses roughly 75-80%. Every percentage point above this threshold is estimated to shave approximately 3.3 basis points off annual economic growth.
- Fiscal Space: When a government is already maxed out, its “fiscal space”—the ability to borrow and spend during emergencies like pandemics or recessions—is severely limited.
- The Interest Trap: As of 2026, interest payments on the debt have ballooned to over $1 trillion annually. For the first time in modern history, we are spending nearly as much on interest as we do on national defense.
Historical Context: From WWII to Today
The only other time the U.S. debt-to-GDP ratio reached these heights was in 1946, immediately following World War II, when it peaked at 106%. However, the “Great Drawdown” of the 1950s was driven by a post-war manufacturing boom and a younger population.
Today’s climb is structural, not temporary. It is driven by an aging population, rising healthcare costs, and a persistent gap where spending averages 21% of GDP while revenue stays at 18%.
How This Affects the Markets
Investors should prepare for a “new normal” where fiscal health dictates market volatility.
- “Crowding Out” Effect: When the government borrows trillions, it competes with the private sector for capital. This “crowding out” can lead to higher long-term interest rates, making it more expensive for businesses to expand and for consumers to get mortgages.
- Bond Market Jitters: We are seeing increased sensitivity in the Treasury market. If investors begin to doubt the U.S. government’s ability to service this debt without resorting to inflation (printing money), they will demand higher yields, leading to further price drops in existing bonds.
- The Growth Ceiling: High debt levels correlate with slower GDP growth. For equity markets, this could mean a lower “ceiling” for corporate earnings over the next decade.
The Bottom Line
Crossing 100% isn’t a guaranteed collapse—countries like Japan have operated at over 200% for years due to strong institutional trust. However, for the U.S., it marks the end of “consequence-free” borrowing.
As the Congressional Budget Office projects the ratio to hit 120% by 2036, the conversation must shift from “if” we should address the deficit to “how” drastically we must rebalance.
Market analysis provided by The Macro Compass is for informational purposes only. Please consult with a financial advisor before making investment decisions.