The world’s most important maritime artery has been constricted, and the pulse is being felt in every corner of the global economy. As the Strait of Hormuz remains effectively closed to a significant portion of global trade this March 2026, we are no longer just looking at a regional conflict—we are looking at a systemic shock to the cost of living.
Here is how the closure of this 21-mile-wide passage is rippling through the economy and, more importantly, your bank account.
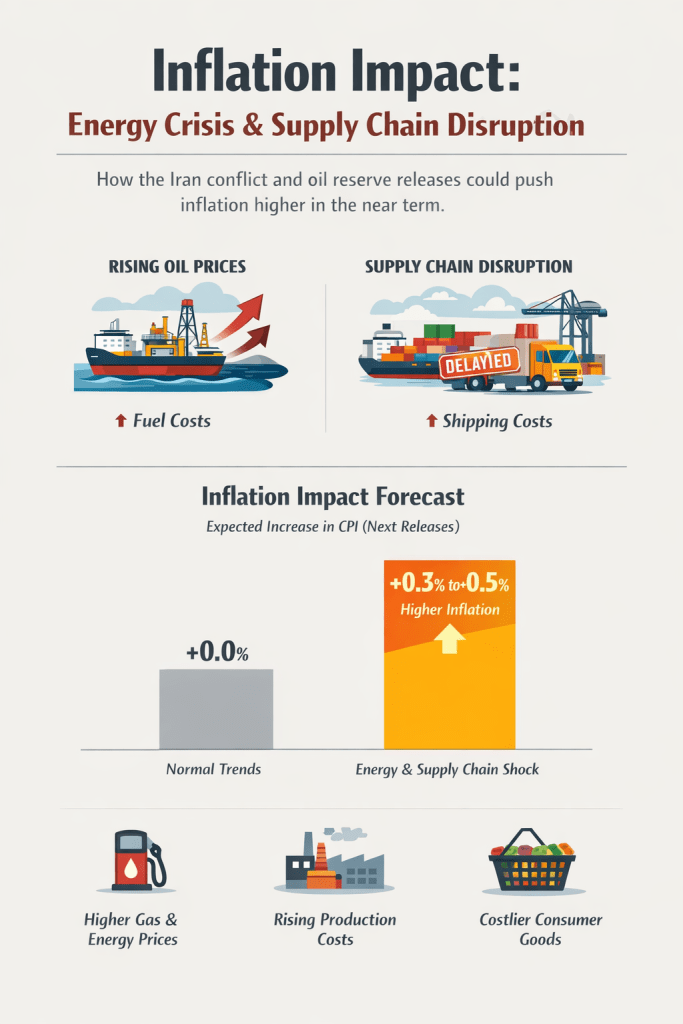
The Energy Shock: Beyond the Gas Pump
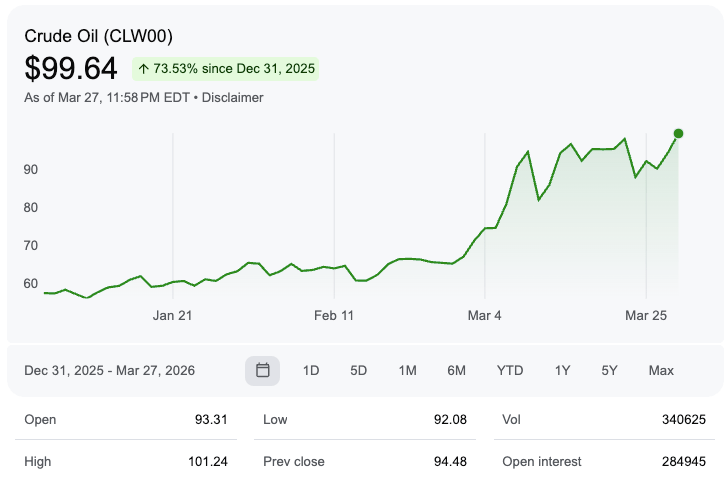
The Strait is the transit point for roughly 25% of the world’s liquid natural gas (LNG) and 20% of its oil. With these supplies stranded, Brent crude has surged past $112 a barrel.
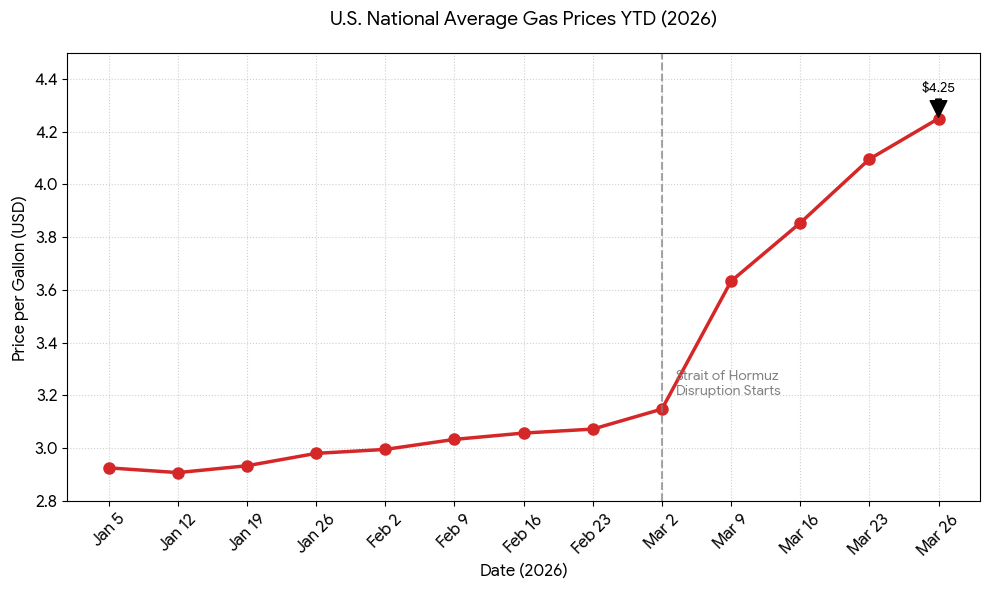
- The Inflation Direct Hit: Rising fuel costs are the “tax” that everyone pays. High energy prices increase the cost of producing and transporting nearly every physical good on earth.
The Kitchen Table: Food and Fertilizer
This is the hidden crisis. The Middle East is a titan in the fertilizer market, responsible for one-third of the world’s seaborne trade in urea and ammonia.
- The Inflation Ripple: With fertilizers stuck behind the blockade, prices have jumped 38%. This isn’t just a problem for farmers; it’s a guaranteed price hike for wheat, fruits, and vegetables (already up 5.2%) in the coming months. When it costs more to grow food, it costs more to buy it.
Manufacturing and Tech: The Helium & Plastic Crisis
It’s not just oil. The region is a massive exporter of petrochemicals (the building blocks of plastic) and helium.
- The Industry Strain: If you’re looking for a new car, a laptop, or even medical services like an MRI, costs are climbing. Helium is essential for semiconductor cooling and medical magnets. The scarcity of these raw materials is forcing manufacturers to raise MSRPs to protect their margins.
Logistics: The Long Way Around
Shipping companies are now rerouting vessels around the Cape of Good Hope. This adds 15 to 20 days to transit times and sends insurance premiums through the roof.
- The Consumer Delay: “Just-in-time” supply chains are breaking down. Expect longer wait times for imported goods and “surcharges” on shipping and airfare as airlines struggle with the massive spike in jet fuel costs.
The Bottom Line: A Stagflationary Threat
The primary concern for the week ahead is Stagflation—a toxic mix of stagnant economic growth and high inflation. As the “cost of everything” rises due to these supply chain breaks, the Federal Reserve faces a nightmare scenario: they may be forced to keep interest rates high to fight inflation, even as the economy begins to slow down under the weight of the conflict.
The closure of the Strait isn’t just a headline about distant tankers; it’s a direct pressure cook on global inflation that will likely define the economic landscape for the rest of the year.