The past week has delivered some of the most dramatic swings in energy and financial markets in years. As Iran ramps up attacks on commercial vessels in the Strait of Hormuz—a waterway that normally handles about 20% of global oil shipments—oil markets have rocketed, some producers have cut output, and governments have responded with unprecedented intervention.
🛢️ Oil Markets: Prices Up, Volatility Up
Despite a historic intervention by the International Energy Agency (IEA) to release 400 million barrels from global strategic reserves—the largest such release in history—oil prices have remained elevated and volatile. Crude benchmarks like Brent have traded above $90–$100 per barrel as supply fears persist.
This demonstrates two key points:
- Reserve releases temper extreme price spikes, but they cannot fully offset sudden disruptions.
- Markets are pricing in a significant risk premium because the Strait of Hormuz remains threatened and regional energy infrastructure is under attack.
⚓ The Strait of Hormuz: A Choke Point With Global Reach
The Strait of Hormuz is a critical artery for global oil. Any disruption affects not only Iranian exports but also supplies from Saudi Arabia, Iraq, Kuwait, and the UAE. Even temporary interruptions trigger rapid price swings as traders hedge for worst-case scenarios.
📉 Broader Market Impact
- Stock markets have wobbled — global equity indexes dipped as oil prices surged and inflation fears grew. Energy costs affect transportation, manufacturing, airlines, and logistics.
- Supply chains beyond energy are strained — freight disruptions and rising shipping costs ripple through global commodity flows.
- Safe-haven assets are in demand — investors rotate into bonds, gold, and other low-risk assets during periods of uncertainty.
💹 Inflationary Pressure Forecast
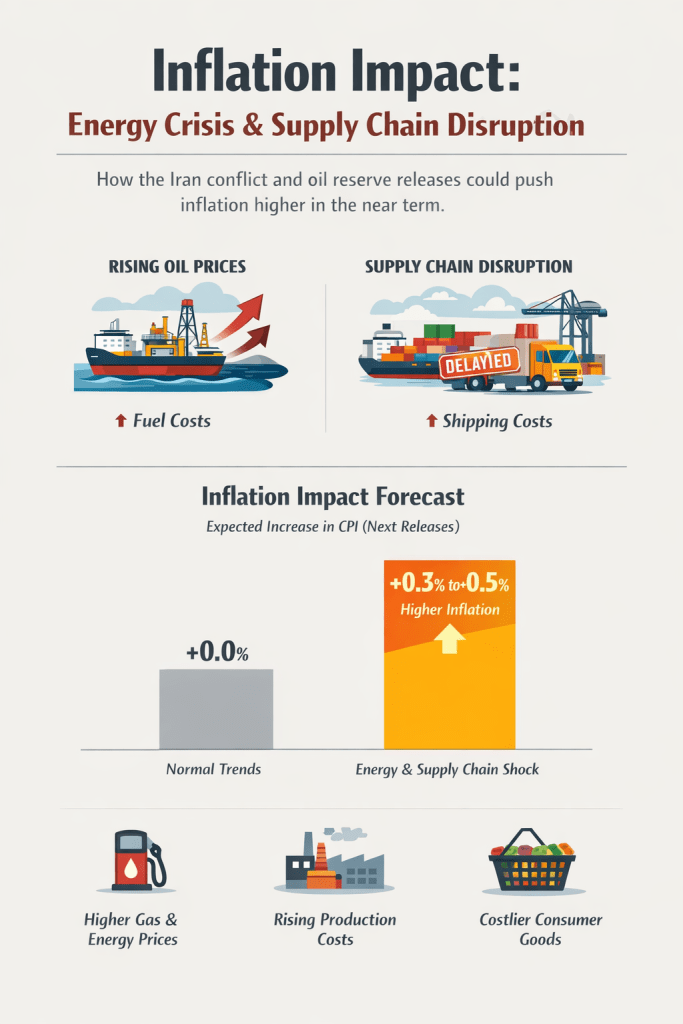
The combination of elevated oil prices and disrupted shipping routes is expected to push inflation higher in the near term. Key points:
- Transportation costs rise as shipping becomes riskier and fuel prices climb.
- Goods production costs increase because petroleum-based inputs for manufacturing and chemicals become more expensive.
- Consumer prices for energy and essential goods are likely to increase in the coming months, adding pressure on headline inflation.
Analysts forecast that inflation readings could be 0.3–0.5% higher than baseline expectations in the next CPI releases, primarily driven by energy and transportation costs. Central banks may respond cautiously, weighing both the temporary nature of the shock and the risk of broader economic slowing.
🧠 What the IEA Release Really Means
The coordinated release of 400 million barrels is extraordinary:
- Provides near-term supply relief
- Signals global policymakers are taking the energy shock seriously
- Demonstrates international cooperation in a global energy crisis
However, markets see it as a stabilizing buffer, not a permanent solution. If attacks in the Strait of Hormuz continue, oil supply shocks and inflationary pressures are likely to persist.
📊 In Summary
With Iran attacking ships in the Strait of Hormuz and a record oil reserve release underway, markets are reacting on multiple fronts:
- Oil prices remain elevated and volatile.
- Equity markets are cautious due to inflation and growth concerns.
- Supply chain costs beyond energy are climbing.
- Inflationary pressure is expected to rise in the near term.
Even with strategic reserve releases, the uncertainty surrounding shipping lanes and regional energy security will keep markets headline-driven in the coming weeks.