As we enter the final week of March 2026, the global economy is facing a perfect storm. With “Operation Epic Fury” escalating and up to 10,000 additional U.S. troops headed to the Middle East, the Strait of Hormuz remains a volatile chokepoint that is effectively redrawing the map for American investors.
For the readers of The Macro Compass, the primary question isn’t just “What is happening?” but “How do I protect my capital?” Here is your strategic navigational chart for the week ahead.
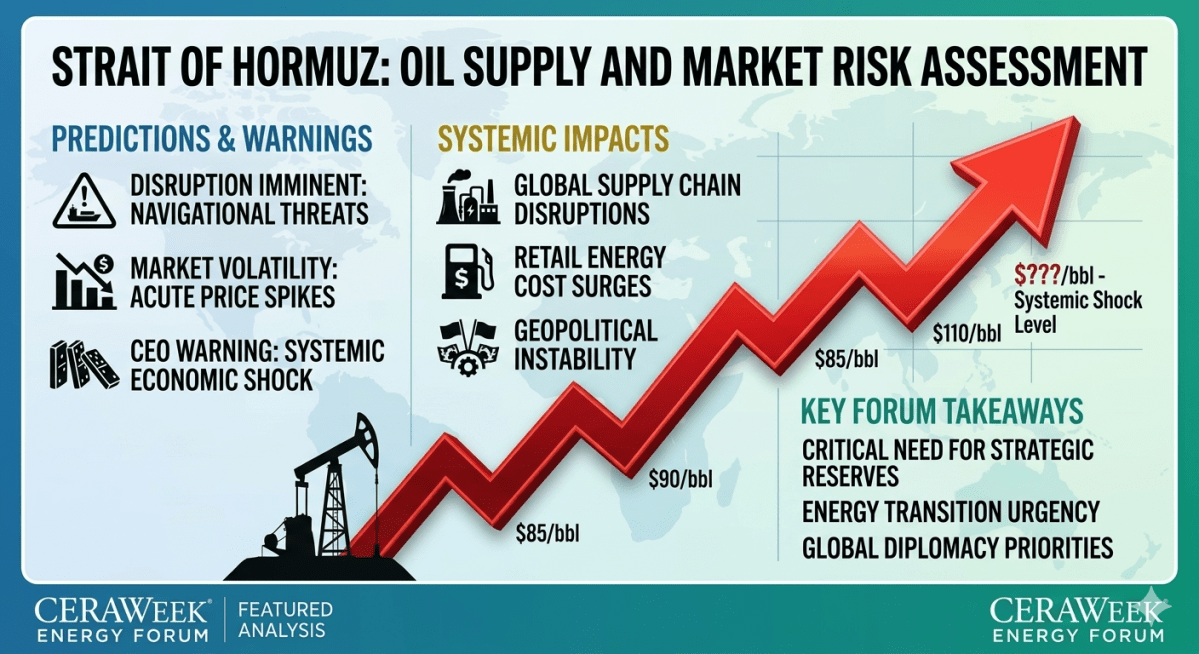
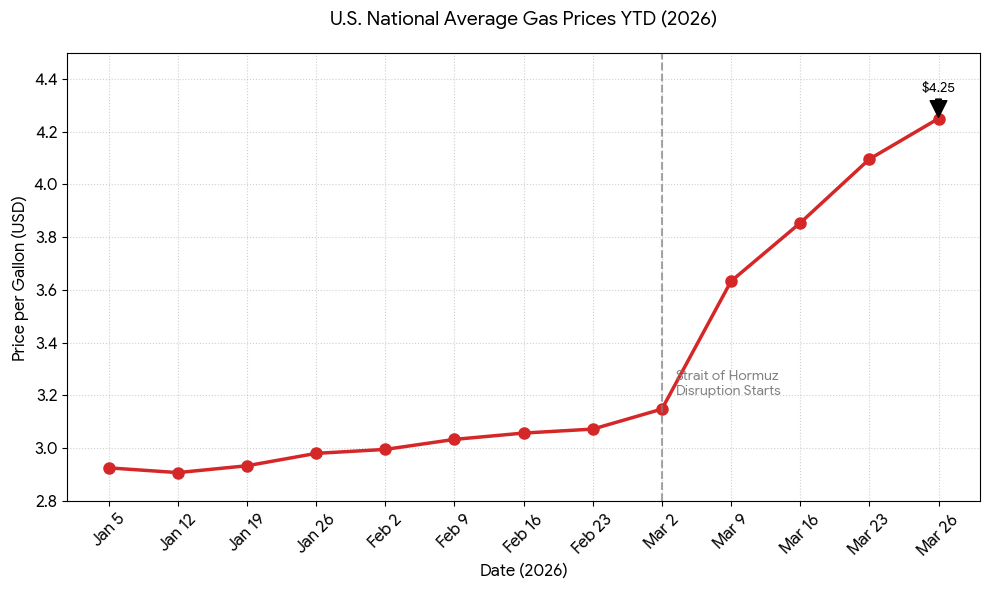
The Energy Shock: Beyond the Gas Pump
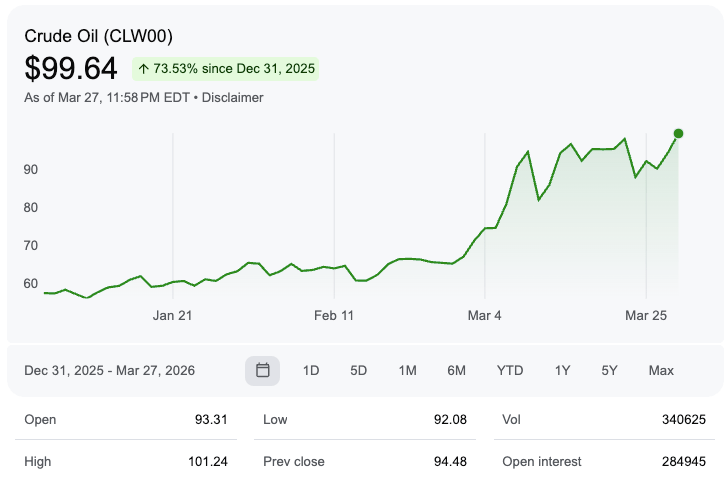
The closure of the Strait is no longer a regional headline—it is a systemic shock to the cost of living. With 20% of global oil and 25% of liquefied natural gas (LNG) currently trapped, Brent crude has surged past $112 a barrel.
- The Inflationary Tsunami: At the recent CERAWeek conference in Houston, oil CEOs like Chevron’s Mike Wirth and Aramco’s Amin Nasser warned that we are underestimating the “physical manifestations” of this closure.
- The Hidden Hit: It’s not just fuel. The region is a titan in the fertilizer market. With supply lines cut, global farming costs have jumped 38%, a move that guarantees double-digit food inflation through the next harvest cycle.
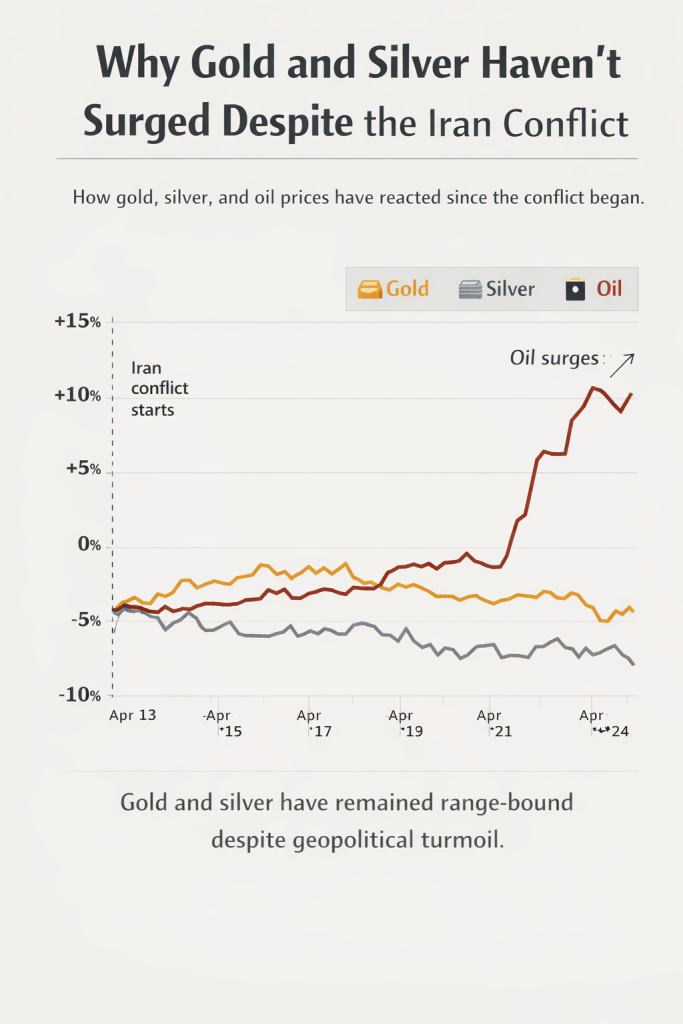
The Safe-Haven Paradox: Are Metals Still the Answer?
When the drums of war beat louder, the traditional playbook says “buy gold.” But in 2026, that playbook is being rewritten by a surging U.S. Dollar.
- Gold ($4,524/oz): Gold remains the ultimate “portfolio insurance,” but we are seeing a sharp pullback from January’s highs of $5,600. This isn’t a lack of faith; it’s a scramble for liquidity.
- Silver ($94/oz): Caught in a “dual identity” crisis, silver is both a monetary hedge and a critical component in the AI and 5G revolutions. Despite recent volatility, the structural supply deficit makes it a strong long-term play.
- Base Metals: If you want to know where consumer prices are headed, watch Copper and Aluminum. Both have surged as international buyers pay record premiums to secure supply.
Strategic Rotation: The Gold-to-Oil Ratio
The Macro Compass is currently tracking a historic anomaly. The Gold-to-Oil Ratio—the number of barrels of oil an ounce of gold can buy—is sitting at a staggering 40:1.
Historically, this ratio hovers around 15 to 20. A ratio this high suggests that while gold has done its job as a hedge, energy equities (XLE) are now significantly “cheaper” relative to bullion than they have been in decades. We are transitioning from a “buy everything” metals phase to a selective accumulation phase where energy stocks may offer better value.
The Bottom Line: A “Risk-Off” Reality
President Trump has characterized the military buildup as leverage for a peace deal, but the markets are pricing in a prolonged conflict. Expect continued volatility in the S&P 500, which has already shed over 4% this month.
The Macro Compass Strategy:
- Hedge with Metals: Maintain a 5%–10% “insurance” allocation in physical gold or silver.
- Rotate into Energy: Look for entries in diversified energy producers while the Gold-to-Oil ratio remains at extremes.
- Watch the Dollar: A strengthening USD will act as a “ceiling” for gold prices in the short term.
Market analysis provided by The Macro Compass is for informational purposes only. Geopolitical events are highly volatile; please consult with a financial advisor before making investment decisions based on conflict-related data.