Key takeaway: Q2’s 3.8% GDP signals the U.S. economy is resilient, lowering the probability of aggressive Fed rate cuts. Cyclical sectors and commodities are poised to benefit, while bonds, gold, and defensive equities may see headwinds.
The latest PPI numbers indicate that inflation pressures at the wholesale/producer level are easing overall, even though a few service categories are still running hot.
🏦 Impact on markets & the Fed:
Bond market → Likely to rally (yields fall) since cooling PPI supports the case for Fed rate cuts.
Equities → Could get a boost, especially rate-sensitive sectors (tech, real estate, small caps), as investors price in lower borrowing costs.
USD → Could weaken if markets see softer inflation + higher odds of rate cuts.
Commodities → May drift lower if weaker input prices persist, though energy and food can swing independently.
🔑 Takeaway:
PPI is an early signal. If it continues trending down, it strengthens the Fed’s case for easing policy. But if consumer inflation (CPI/PCE) stays sticky, the Fed may still tread carefully.
Here’s what the latest PPI (Producer Price Index) numbers show — and what they’re likely to mean for markets / policy.
🔍 What the Data Says
From the U.S. Bureau of Labor Statistics:
PPI for final demand declined 0.1% in August (seasonally adjusted).
On a year-over-year basis, producer prices rose 2.6%.
Core PPI (excluding food, energy, and trade services) rose 0.3% month-over-month for August.
Final demand services dropped ~0.2% for the month. Final demand goods rose about 0.1%.
So, broadly: wholesale inflation cooled in August, with some price pressures still present (especially in core PPI), but not accelerating.
⚙️ What It Indicates
A few key takeaways from these numbers:
Cooling Inflation Pressures Upstream
The drop in final demand services suggests companies aren’t easily passing on price increases (for services/trade).
Goods inflation is modest, which means upstream input costs aren’t surging out of control.
Core Inflation Remains Sticky but Manageable
The core PPI rise (excluding volatile food, energy, trade services) shows that inflation in some sectors is still active.
But with final demand overall dipping, there’s potential for this to feed into lower consumer inflation over time.
Tariffs & Trade Pressures May Be Easing
Some analysts point out that import/wholesale price effects from tariffs and disrupted supply chains might be moderating or getting absorbed.
Supports Case for Fed Rate Cuts (But Cautiously)
Softer wholesale inflation gives the Federal Reserve more wiggle room to consider easing.
However, the Fed will still want to see CPI or PCE inflation behaving similarly before acting aggressively.
📈 Likely Market / Policy Reactions
Given this PPI report, here’s how markets and policymakers are likely to respond:
Asset / Policy
Likely Impact
Stocks
Positive overall. Especially rate-sensitive sectors (housing, tech) should benefit from the idea that inflation (and thus rates) may be under control.
Bonds
Yields (especially short-term) likely drop as traders increase the probability of a Fed rate cut. Bonds rally.
U.S. Dollar
Probably weaker, as rate expectations ease and real yields diminish somewhat.
Gold / Safe Assets
Likely to gain, as inflation remains present but not accelerating dramatically — safe havens tend to benefit in that environment.
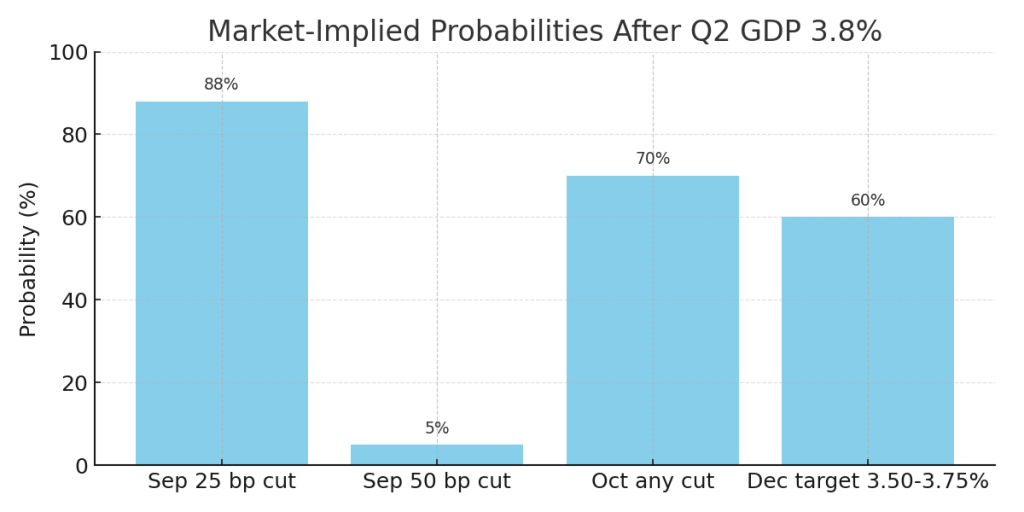
Fed Policy
A 25 bps cut seems more likely; bigger moves would hinge on additional weak data (CPI, labor). The Fed would probably proceed carefully, emphasizing data dependence.
🧮 Risks & What to Watch
If upcoming CPI or PCE inflation reports surprise to the upside, this cooling trend could reverse.
Labor market strength/hiring could still push inflation via wage pressure, which the PPI doesn’t fully capture.
Persistent inflation expectations (consumers, businesses) can become self-fulfilling, undermining these soft signals.