Here’s a breakdown of the likelihood of another Federal Reserve rate cut and what that could mean for markets:
✅ Probability of Another Rate Cut
Market-based tools (like the CME Group FedWatch Tool) show ≈ 90%+ probability of a 25-basis-point cut at the next meeting (late October 2025).
Futures markets are also pricing in ~70–80 basis points of total cuts in 2025 after the already-announced September cut.
While a cut is very likely, there’s uncertainty about magnitude and timing beyond the next meeting; the Fed emphasizes it’s not on a “preset path.”
📊 Market Outlook Given Another Rate Cut
What the market is likely to do
Stocks: Growth stocks (especially tech and long-duration names) and rate-sensitive sectors (housing, REITs) may rally as borrowing costs decrease and future earnings look more valuable.
Bonds: Short-term yields should fall as the policy rate is cut; long-term yields may fall too if growth/ inflation fears dominate, which means bond prices rise.
U.S. Dollar: Likely to weaken somewhat — lower short-term interest rates reduce foreign-investor demand for USD-denominated assets.
Gold & safe assets: Could benefit as real yields (nominal yields minus inflation) drop, enhancing the appeal of non-yielding but inflation/allocation assets.
Commodities: May get a boost, especially if the cut is seen as pre-emptive and supports growth; but if the cut signals deepening economic weakness, commodities may falter.
Potential caveats & risks
If the cut is seen as a signal of economic weakness (rather than confidence) — e.g., labor market weak, growth faltering — then markets may start to worry about earnings declines and recession risk, which could offset the initial positive reaction.
If inflation remains sticky, the Fed may highlight caution about further cuts; growth/tech may lag if rate cuts appear insufficient to stimulate.
The magnitude of reaction may depend on communication: how the Fed frames forward guidance matters as much as the cut itself.
Recession worries are one of the biggest drivers of market sentiment right now — even more than inflation or rates — because they affect earnings, consumer demand, and Fed policy expectations. Let’s break it down clearly:
⚠️ Why Recession Worries Are Rising
Several recent data points are fueling renewed concern:
Job revisions: BLS downward revision of ~911,000 jobs suggests the labor market was weaker than reported.
Consumer spending: Slowing in discretionary areas (travel, retail, autos) indicates households are tightening budgets.
Manufacturing and housing: Both showing contraction or stagnation — leading indicators of growth.
Yield curve inversion: Still one of the most reliable predictors of recession (2-year > 10-year).
Corporate commentary: Q3 earnings calls show more cautious outlooks, especially in cyclicals and tech hardware.
M2 money supply is at an all-time high (or reaching record levels), that’s a meaningful macro signal. Whether it’s “good” or “bad” depends heavily on other factors (velocity of money, inflation, growth, how the Fed responds). Here’s how to think about it, and what it could imply for markets:
🔍 What M2 Captures & Why It Matters
Definition: M2 is a broad monetary aggregate that includes currency in circulation, checking deposits, savings accounts, time deposits under $100,000, and certain money market funds.
Liquidity gauge: Because M2 includes funds that are relatively liquid, a high M2 signals there’s a lot of money “in the system” that could be deployed into spending, investment, or asset markets.
Theoretical link to inflation: Classic monetary theory (e.g. the Quantity Theory of Money) suggests that increases in money supply, if velocity is stable or rising, tend to lead to inflation—i.e. “too much money chasing too few goods.”
But in practice, that link is messy because velocity, credit conditions, and demand matter too.
⚠️ Caveats / Moderating Factors
Velocity of money is often declining — money may increase, but people might hold it rather than spend it.
Credit constraints / risk aversion can inhibit money from circulating (i.e., banks may not lend, businesses not invest).
Time lags: Money supply changes may take months or years to show up in inflation, growth, or asset prices.
Policy reaction: If inflation surprises, the Fed can tighten (or delay cuts), pulling back some of the effect.
📈 Market Impacts of High M2
If M2 is indeed at a record high, here are the likely ripple effects across markets (assuming other conditions like some inflation pressure and a somewhat stable growth environment):
Market Segment
Expected Reaction / Risk
Why
Equities (growth, small-cap, cyclical)
Positive tailwind
More liquidity → more capital chasing returns → supports risk assets
Real estate / REITs
Favorable
More money available for mortgage credit or property investment
Markets may price in inflation, reducing bond prices
Dollar (FX)
Potential weakening
More money supply can devalue currency if inflation expectations shift upward
🧭 What It Means for the Fed and Policy
A high M2 gives the Fed less room to cut aggressively, because too much money in the system already threatens inflation overheating.
The Fed may lean more cautiously or even hold rates or tighten if inflation surprises upward.
If the Fed does cut, markets may interpret cuts more as acknowledging growth weakness rather than easing inflation — less uplift than expected.
Looking at recent data, there is support for the idea that the high M2 is pushing (or at least exerting pressure on) inflation, but it’s not a perfect one-to-one relationship. The relationship shows up more strongly over longer lags. Here’s what I found and how to interpret it:
📊 Recent M2 Growth & Inflation Metrics
Here are some specific figures and observations from recent data:
M2 Level & Growth
M2 (seasonally adjusted) in August 2025 was about $22,195.4 billion (≈ $22.20 trillion)
Over the past year, M2 has grown ~ 4.77% year over year
Month over month (Aug vs Jul) it rose by ~0.36%
Inflation / Price Metrics
The chart from LongTermTrends plots historical yearly M2 growth vs CPI inflation, showing that over many periods, M2 growth and inflation tend to move together (though with lag)
The St. Louis Fed’s analysis notes that historically, inflation has “followed” M2 growth with a lag (often 6–18 months), consistent with monetarist views.
The St. Louis Fed also emphasizes that the relationship has “long and variable lags” — meaning M2 expansion doesn’t immediately translate into inflation, but over time the pressure builds.
Recent Observations & Commentary
Some sources note that M2’s annual growth approaching ~5% is concerning, historically, from an inflation risk standpoint.
Finance sites report that M2 reached record highs (i.e. “U.S. M2 money supply hits record high of nearly $22T”) which underscores the magnitude of liquidity in the system.
🧠 Interpretation & What It Suggests
Putting those facts together, here’s how to interpret the signal:
Lagged inflation risk is likely elevated The high M2 growth suggests there is more liquidity in the system. If velocity (the rate at which money circulates) picks up or remains stable, that liquidity can translate into demand-pull inflation. Because past studies show lags, inflation pressures may intensify in coming quarters.
If inflation is already sticky, M2 adds fuel Given that inflation hasn’t fully normalized and there are ongoing pressures (trade, tariffs, labor costs), the elevated M2 offers more “ammunition” for inflation rather than being easily absorbed.
Not a guarantee — context matters The fact that M2 growth is high doesn’t force inflation; other factors like weak demand, high capacity, tight credit, or falling velocity can mute the effect. Indeed, many economists argue that in modern banking/financial systems, the direct linkage between money aggregates and inflation is weaker than classical monetarist theory suggested.
Policy constraints increase With M2 high, the Fed has less room to “loosen up” without risking overheating. If inflation surprises upward, the Fed might delay cuts or even tighten further — which creates more tension for markets.
✅ Bottom Line
A record-high M2 isn’t inherently bad — it could support growth and asset markets if other conditions are favorable.
But it raises a caution flag: the more money there is, the more sensitive markets become to inflation surprises or monetary tightening.
In the current climate — sticky inflation, weak labor, geopolitical risks — a high M2 elevates the stakes.
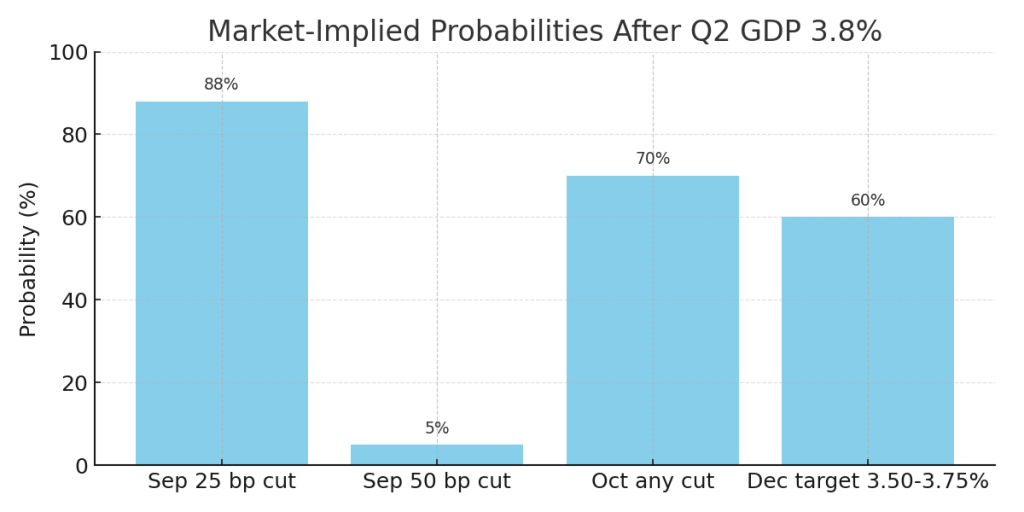
Key takeaway: Q2’s 3.8% GDP signals the U.S. economy is resilient, lowering the probability of aggressive Fed rate cuts. Cyclical sectors and commodities are poised to benefit, while bonds, gold, and defensive equities may see headwinds.
Short answer: Markets & big forecasters put the U.S. recession probability for the rest of 2025 roughly in the 30–40% range today, but estimates vary from the low-teens up to the 50–60% area depending on the model and timing of the call.
Here’s a quick, sourced read on why that range is so wide and what could push it higher or lower.
Why forecasters disagree
Different models & inputs. Some groups (Goldman, JPMorgan, IMF, private forecasters) weight trade/tariffs, payroll revisions, inflation, and financial-market signals differently — producing Goldman ≈30%, JPMorgan ≈40% (recent update), and IMF/others ~40% estimates. (fi-desk.com)
Timing matters. A model that asks “recession in next 6 months?” gives different odds than “recession this calendar year.”
Fast-changing data. Big downward payroll revisions, sticky core inflation prints, or new tariff moves rapidly change the odds (markets reprice in days).
Key drivers that raise recession odds
Major, persistent labor weakness (continued big payroll downgrades or rising unemployment).
A sharp earnings and hiring pullback that feeds into consumer spending declines.
Policy confusion — sticky inflation plus weak growth could force the Fed into a painful tradeoff (no cut = growth hit; cut = inflation re-acceleration).
Escalating trade or geopolitical shocks that damage exports/supply chains. (Federal Reserve)
Key drivers that lower odds
Inflation falling more clearly (PPI/CPI/PCE easing), giving the Fed room for orderly cuts and supporting demand.
Resilient corporate capex, especially AI-related investment, keeping jobs and earnings supported.
Trade de-escalation or fiscal support that offsets private weakness. (IMF)
Market implications if odds rise vs fall
Odds rise (recession more likely): bonds rally (yields ↓), gold and safe havens ↑, cyclical equities and financials underperform, tech/quality may initially rally on rate cuts but could fall if earnings deteriorate.
Odds fall (soft landing more likely): equities rally broadly (tech + cyclicals), yield curve may steepen moderately, USD softens.
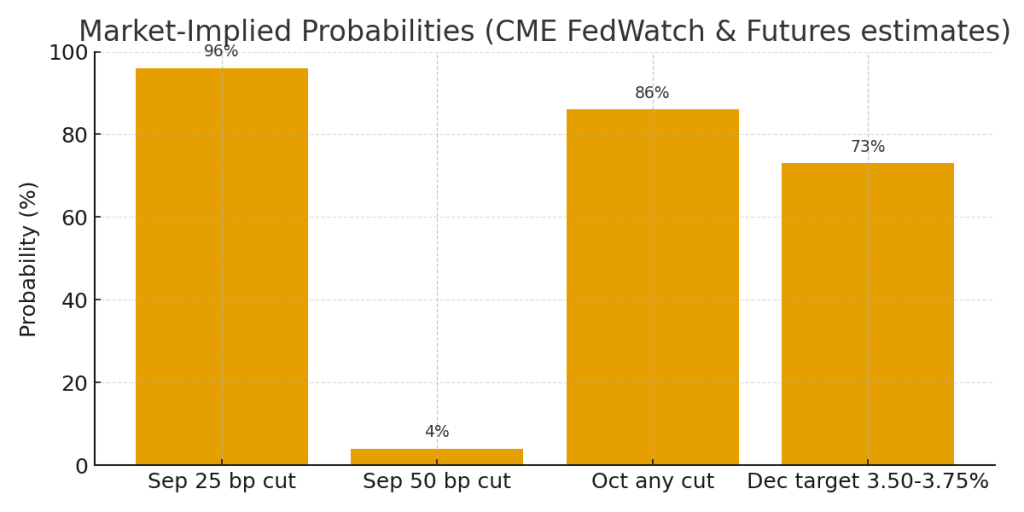
1) Market-implied probabilities (what markets are pricing now)
September 2025 meeting (next FOMC)
~95–96% probability of a 25 bps cut (i.e., markets expect a quarter-point cut). (CME Group)
October 2025 meeting
Odds for another cut in October have jumped — Reuters notes futures lifted chances for easing in October to ~86% after the September cut. (Reuters)
Total easing priced for 2025 (by year-end)
Markets are pricing roughly ~60–80 bps of cuts in total for 2025 (i.e., 2–3 quarter-point cuts including the one in September). Many futures-based trackers and analysts converge around ~70 bps of cuts priced in for the remainder of the year. (Reuters)
Probability of a “jumbo” 50 bps cut in September
Still low but non-zero — generally ~5–10% depending on the source. Statista / CME snapshots and news pieces put this in single digits. (Statista)
Recession probability context
Major banks’ published recession probabilities are clustered in the ~30–40% range for a U.S. recession within the next 12 months, though models vary. (Markets and some houses earlier priced higher and then trimmed odds as data evolved). (JPMorgan Chase)
2) Two scenario models and the expected market reactions
I’ll show each scenario, how likely markets currently think it is, the immediate asset reactions, sector winners/losers, and suggested portfolio tilts and risk controls.
Scenario A — Soft Landing (base / market-priced)
Probability (market-implied): ~50–65% (markets are leaning toward this via FedWatch + futures pricing). (CME Group)
Description: Fed cuts ~25 bps in Sept and another 25 bps later in 2025; inflation drifts lower, jobs stabilize (no large spike in unemployment), growth slows but remains positive.
Immediate asset moves (days → weeks):
Stocks: Mild-to-moderate rally; tech, growth, REITs and small caps outperformance.
Bonds: Short-term yields fall (2-yr down), long yields drift down less → yield curve steepens modestly.
Dollar: Modestly weaker.
Gold: Rises modestly.
Commodities/Oil: Mixed; oil steadies on demand hopes.
Sector winners / losers
Winners: Tech/AI/semi equipment, housing/REITs, consumer discretionary, small caps.
Losers/underperformers: Short-duration financials (some margin compression), defensives (utilities/staples) may lag.
Bonds: +5–10% overweight high-quality duration (2–7 year Treasuries).
Cash: Trim — 5% buffer to buy dips.
Gold: +2–4% as insurance.
Risk management:
Keep stops or hedges on concentrated tech positions (market is sensitive to guidance).
Ladder Treasuries (reduce reinvestment shock).
Scenario B — Hard Landing / Recession Risk
Probability (market-implied tail risk): ~20–35% (markets price a nontrivial chance; some forecasters place odds higher ~30–40%). (JPMorgan Chase)
Description: Despite cuts (25–50 bps total), payroll revisions/ongoing weakness push unemployment higher, corporate earnings degrade. Cuts are seen as reactive, not preventive → growth contracts.
Immediate asset moves:
Stocks: Short-term rally on initial dovish surprise may give way to a broader equity selloff as earnings forecasts get cut. Cyclicals and small caps hit hardest.
Bonds: Strong rally (yields fall across curve), 2-yr falls sharply as Fed cuts are front-loaded.
Dollar: Initially weak on cuts, but can become volatile — in a global risk-off the USD can strengthen as a safe haven.
Here’s what the latest U.S. unemployment trend looks like, and how markets reacted to the most recent report:
📈 What the Unemployment Data Shows
The unemployment rate in August 2025 rose to 4.3%, up from 4.2% in July.
Labor force participation and the employment-population ratio have stayed relatively stable month to month, though both are down somewhat over the past year.
Nonfarm payrolls showed weak job growth (only ~22,000 jobs added in August), and recent data revisions have cut previous job growth estimates significantly downward.
Long-term unemployment (those unemployed 27 weeks or more) is elevated (around 1.9 million), and makes up over 25% of all unemployed workers.
⚙️ How Markets Reacted
After the weak jobs/unemployment print, bond markets rallied — short-term Treasury yields dropped, as investors increasingly believe the Fed will need to ease policy.
Stocks had a mixed reaction: some gains in rate-sensitive sectors (like tech and growth) because a weaker labor market increases the odds of rate cuts, but also concern in more cyclical sectors over weakening demand.
The weak jobs report increased market expectations for future rate cuts from the Fed. Analysts & firms revised forecasts to anticipate easier monetary policy in coming Fed meetings.
🔍 What This Suggests Going Forward
The elevated unemployment rate plus weak job additions suggest that the labor market is cooling. Because the jobs picture is one of the Fed’s two mandates (the other being inflation), these trends push monetary policy toward being more accommodative. Markets are likely to expect:
Further rate cuts (but likely gradual, depending on inflation data)
Continued cautious investor behavior — sectors dependent on strong demand may be under pressure
Increased volatility around economic releases (jobs, inflation) as they’ll be seen as key indicators for Fed actions
Here are recent estimates showing how likely markets think further Fed rate cuts are, based on futures & other data:
Smaller chance; often seen as less likely for a bigger move. (Morningstar)
By end of 2025
Markets are expecting multiple cuts; total cuts priced in are ~70 bps. (Reuters)
But large, back-to-back cuts (50 bps each time) are seen as less likely. (Morningstar)
Here’s a summary of how market expectations (via CME FedWatch and related tools) for Fed rate moves have shifted recently — especially in light of weak jobs + inflation data:
Seen as unlikely but rising slightly — a “dovish surprise” scenario.
End of 2025 (Dec meeting)
~ 75-80% chance that target rate will be ~ 3.50-3.75% (i.e. another cut or two beyond September) (Investing.com)
Was lower earlier in the summer; markets have been shifting toward more cuts priced in. (Investing.com)
Reflects growing consensus that loosening is likely as economic data cools.
⚙️ Interpretation
These shifts show markets rapidly adapting to softer economic signals — especially weak job growth and downward revisions.
The nearly-certain expectation of a 25 bps cut in September suggests that new data is no longer enough to shift odds away from that outcome.
The possibility of a larger cut (50 bps) has increased slightly, but remains low — viewed more as a potential tail-risk if conditions deteriorate further.
By late 2025, markets expect more easing (i.e. one or more additional cuts), though how many and how big depends heavily on inflation and jobs trajectories.
Based on the latest information, it’s quite likely that the Fed will cut rates at least a couple more times this year. Here’s a breakdown of the evidence, the Fed’s stance, and what could make cuts more or less likely:
✅ Why More Cuts Are Likely
Recent Cut + Dot Plot Projections After cutting the fed funds rate by 25 basis points (bps), Fed officials projected two more quarter-point cuts for the remainder of 2025. (Reuters)
Economic Indicators Softening The labor market is weakening (job growth slowing, revisions showing far fewer jobs added), which shifts the Fed’s risk assessment toward downside risks for employment. (Reuters) Inflation remains above target but hasn’t been accelerating aggressively, giving the Fed some leeway. (Federal Reserve)
Market Expectations Futures markets and major banks are leaning toward more cuts. For example, JPMorgan sees a strong chance of another 25-bps cut, and some analysts believe there could be three or more cuts into early 2026. (Business Insider)
⚠️ What Could Prevent or Limit Further Cuts
If inflation (especially core PCE or CPI) remains stubbornly high or turns up again, that could make the Fed more cautious.
Stronger-than-expected economic data (GDP growth, consumer spending, manufacturing) might reduce pressure to ease.
Global risks or shocks (e.g. energy price spikes, geopolitics, trade policy issues) that push up inflation or disrupt supply chains.
Concerns about losing credibility in inflation control could push the Fed to move slower.
📊 What to Expect
Here’s a rough timeline and what markets are pricing in:
Two more 25-bps cuts during the rest of 2025, likely at upcoming FOMC meetings. (Reuters)
Possible one more cut in early 2026, depending on how inflation and labor market data evolve. (Federal Reserve)
The Feds just cut interest rates by 25 basis point (bp). Here’s what that signals and how it ripples out:
🏦 Economic Meaning
Cheaper Credit: Mortgages, auto loans, and business loans gradually become cheaper.
Stimulus: Encourages spending and investment, aiming to support slowing growth.
Confidence Signal: A 25 bp cut is a measured step — not panic, but a sign the Fed sees the economy softening.
Inflation Watch: The Fed is easing, but carefully — they’re not sure inflation is fully under control.
📊 Market Impact
Stocks: Generally bullish — especially for growth/tech and real estate. But if investors think the cut means a looming recession, gains may fade.
Bonds: Short-term yields fall most, boosting bond prices. Long-term yields may fall too if growth fears rise.
U.S. Dollar: Slightly weaker — lower yields make USD less attractive.
Gold/Commodities: Gold often rises (lower real yields), oil/metals can benefit if growth looks supported.
Banks: Mixed — loan demand improves, but margins may narrow.
⚖️ Context
If inflation is falling, this cut looks supportive → “soft landing” optimism.
If inflation is still sticky, the cut risks fueling more price pressures → markets may get nervous.
✅ Bottom line: A 25 bp cut is the Fed’s way of saying: “We see the economy slowing, but we’re not in crisis mode.” It’s a supportive move, not a rescue move.
When the Fed cuts rates, the market reacts differently depending on why the cut is happening (growth slowdown vs. financial stress vs. inflation under control). But here’s the typical playbook:
📉 Bonds
Short-term Treasuries (2Y, 5Y): Yields drop the most — directly tied to Fed policy.
Long-term Treasuries (10Y+): Can fall too, but if markets worry about inflation, the drop is smaller.
✅ Net: Bond prices rise, especially in the short end.
The latest PPI numbers indicate that inflation pressures at the wholesale/producer level are easing overall, even though a few service categories are still running hot.
🏦 Impact on markets & the Fed:
Bond market → Likely to rally (yields fall) since cooling PPI supports the case for Fed rate cuts.
Equities → Could get a boost, especially rate-sensitive sectors (tech, real estate, small caps), as investors price in lower borrowing costs.
USD → Could weaken if markets see softer inflation + higher odds of rate cuts.
Commodities → May drift lower if weaker input prices persist, though energy and food can swing independently.
🔑 Takeaway:
PPI is an early signal. If it continues trending down, it strengthens the Fed’s case for easing policy. But if consumer inflation (CPI/PCE) stays sticky, the Fed may still tread carefully.
Here’s what the latest PPI (Producer Price Index) numbers show — and what they’re likely to mean for markets / policy.
🔍 What the Data Says
From the U.S. Bureau of Labor Statistics:
PPI for final demand declined 0.1% in August (seasonally adjusted).
On a year-over-year basis, producer prices rose 2.6%.
Core PPI (excluding food, energy, and trade services) rose 0.3% month-over-month for August.
Final demand services dropped ~0.2% for the month. Final demand goods rose about 0.1%.
So, broadly: wholesale inflation cooled in August, with some price pressures still present (especially in core PPI), but not accelerating.
⚙️ What It Indicates
A few key takeaways from these numbers:
Cooling Inflation Pressures Upstream
The drop in final demand services suggests companies aren’t easily passing on price increases (for services/trade).
Goods inflation is modest, which means upstream input costs aren’t surging out of control.
Core Inflation Remains Sticky but Manageable
The core PPI rise (excluding volatile food, energy, trade services) shows that inflation in some sectors is still active.
But with final demand overall dipping, there’s potential for this to feed into lower consumer inflation over time.
Tariffs & Trade Pressures May Be Easing
Some analysts point out that import/wholesale price effects from tariffs and disrupted supply chains might be moderating or getting absorbed.
Supports Case for Fed Rate Cuts (But Cautiously)
Softer wholesale inflation gives the Federal Reserve more wiggle room to consider easing.
However, the Fed will still want to see CPI or PCE inflation behaving similarly before acting aggressively.
📈 Likely Market / Policy Reactions
Given this PPI report, here’s how markets and policymakers are likely to respond:
Asset / Policy
Likely Impact
Stocks
Positive overall. Especially rate-sensitive sectors (housing, tech) should benefit from the idea that inflation (and thus rates) may be under control.
Bonds
Yields (especially short-term) likely drop as traders increase the probability of a Fed rate cut. Bonds rally.
U.S. Dollar
Probably weaker, as rate expectations ease and real yields diminish somewhat.
Gold / Safe Assets
Likely to gain, as inflation remains present but not accelerating dramatically — safe havens tend to benefit in that environment.
Fed Policy
A 25 bps cut seems more likely; bigger moves would hinge on additional weak data (CPI, labor). The Fed would probably proceed carefully, emphasizing data dependence.
🧮 Risks & What to Watch
If upcoming CPI or PCE inflation reports surprise to the upside, this cooling trend could reverse.
Labor market strength/hiring could still push inflation via wage pressure, which the PPI doesn’t fully capture.
Persistent inflation expectations (consumers, businesses) can become self-fulfilling, undermining these soft signals.